29
/
en
AIzaSyAYiBZKx7MnpbEhh9jyipgxe19OcubqV5w
April 1, 2024
237856
Serbia
SRB
true
2
1
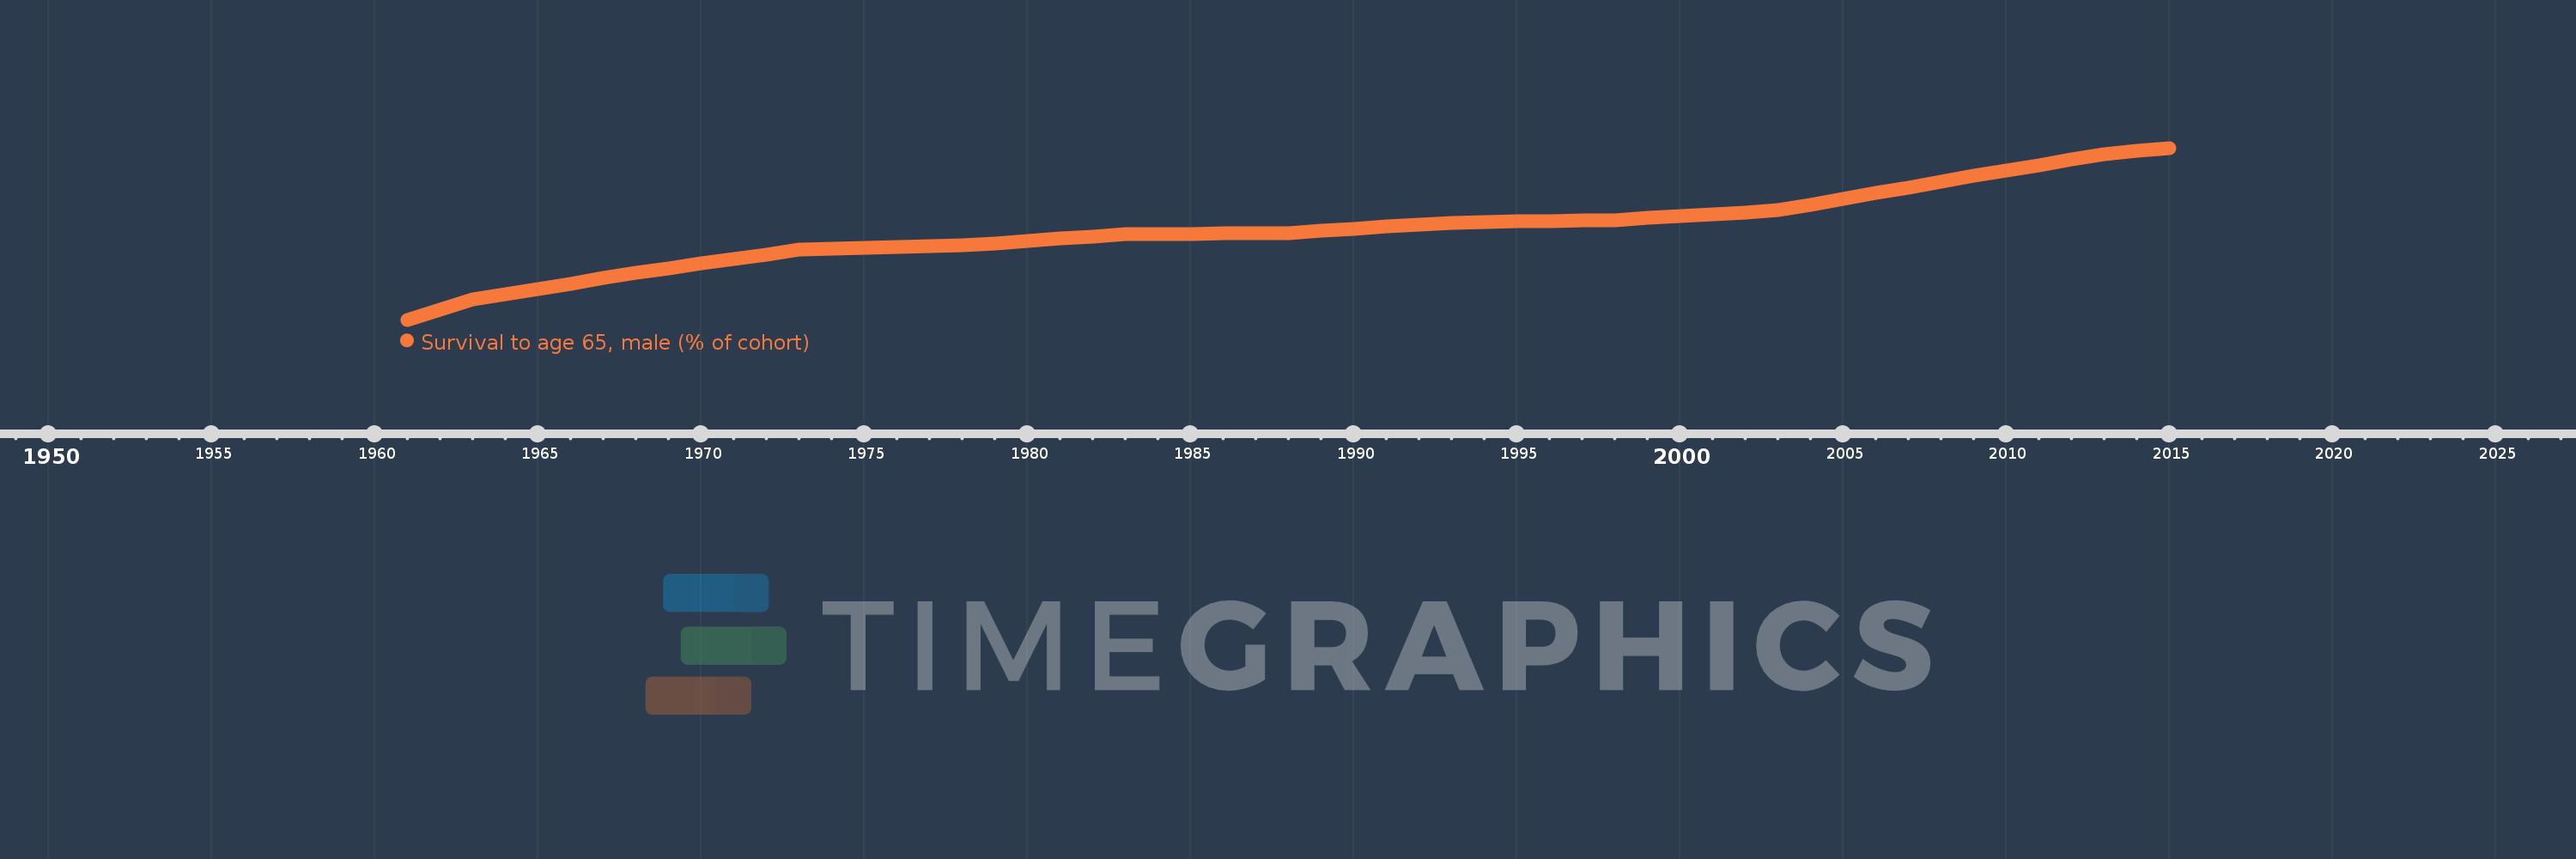
Survival to age 65, male (% of cohort)
2015,2014,2013,2012,2011,2010,2009,2008,2007,2006,2005,2004,2003,2002,2001,2000,1999,1998,1997,1996,1995,1994,1993,1992,1991,1990,1989,1988,1987,1986,1985,1984,1983,1982,1981,1980,1979,1978,1977,1976,1975,1974,1973,1972,1971,1970,1969,1968,1967,1966,1965,1964,1963,1962,1961
This statistics in other country:
AfghanistanAlbaniaAlgeriaAngolaAntigua and BarbudaArab WorldArgentinaArmeniaArubaAustraliaAustriaAzerbaijanBahamas, TheBahrainBangladeshBarbadosBelarusBelgiumBelizeBeninBhutanBoliviaBosnia and HerzegovinaBotswanaBrazilBrunei DarussalamBulgariaBurkina FasoBurundiCabo VerdeCambodiaCameroonCanadaCaribbean small statesCentral African RepublicCentral Europe and the BalticsChadChannel IslandsChileChinaColombiaComorosCongo, Dem. Rep.Congo, Rep.Costa RicaCote d'IvoireCroatiaCubaCuracaoCyprusCzech RepublicDenmarkDjiboutiDominican RepublicEarly-demographic dividendEast Asia & PacificEast Asia & Pacific (excluding high income)East Asia & Pacific (IDA & IBRD countries)EcuadorEgypt, Arab Rep.El SalvadorEquatorial GuineaEritreaEstoniaEthiopiaEuro areaEurope & Central AsiaEurope & Central Asia (excluding high income)Europe & Central Asia (IDA & IBRD countries)European UnionFijiFinlandFragile and conflict affected situationsFranceFrench PolynesiaGabonGambia, TheGeorgiaGermanyGhanaGreeceGrenadaGuamGuatemalaGuineaGuinea-BissauGuyanaHaitiHeavily indebted poor countries (HIPC)High incomeHondurasHong Kong SAR, ChinaHungaryIBRD onlyIcelandIDA & IBRD totalIDA blendIDA onlyIDA totalIndiaIndonesiaIran, Islamic Rep.IraqIrelandIsraelItalyJamaicaJapanJordanKazakhstanKenyaKiribatiKorea, Dem. People’s Rep.Korea, Rep.KuwaitKyrgyz RepublicLao PDRLate-demographic dividendLatin America & Caribbean Latin America & Caribbean (excluding high income)Latin America & the Caribbean (IDA & IBRD countries)LatviaLeast developed countries: UN classificationLebanonLesothoLiberiaLibyaLithuaniaLow & middle incomeLow incomeLower middle incomeLuxembourgMacao SAR, ChinaMacedonia, FYRMadagascarMalawiMalaysiaMaldivesMaliMaltaMauritaniaMauritiusMexicoMicronesia, Fed. Sts.Middle East & North AfricaMiddle East & North Africa (excluding high income)Middle East & North Africa (IDA & IBRD countries)Middle incomeMoldovaMongoliaMontenegroMoroccoMozambiqueMyanmarNamibiaNepalNetherlandsNew CaledoniaNew ZealandNicaraguaNigerNigeriaNorth AmericaNorwayOECD membersOmanOther small statesPacific island small statesPakistanPanamaPapua New GuineaParaguayPeruPhilippinesPolandPortugalPost-demographic dividendPre-demographic dividendPuerto RicoQatarRomaniaRussian FederationRwandaSamoaSao Tome and PrincipeSaudi ArabiaSenegalSerbiaSeychellesSierra LeoneSingaporeSlovak RepublicSloveniaSmall statesSolomon IslandsSomaliaSouth AfricaSouth AsiaSouth Asia (IDA & IBRD)South SudanSpainSri LankaSt. LuciaSt. Vincent and the GrenadinesSub-Saharan Africa Sub-Saharan Africa (excluding high income)Sub-Saharan Africa (IDA & IBRD countries)SudanSurinameSwazilandSwedenSwitzerlandSyrian Arab RepublicTajikistanTanzaniaThailandTimor-LesteTogoTongaTrinidad and TobagoTunisiaTurkeyTurkmenistanUgandaUkraineUnited Arab EmiratesUnited KingdomUnited StatesUpper middle incomeUruguayUzbekistanVanuatuVenezuela, RBVietnamVirgin Islands (U.S.)West Bank and GazaWorldYemen, Rep.ZambiaZimbabwe Timeline:
This timeline shows a graph from 1961 to 2015 of Serbia. No data until 1960. Number of actual observations by date: 55.
Source name:
World Development Indicators
Source organization:
United Nations Population Division. World Population Prospects. New York, United Nations, Department of Economic and Social Affairs (advanced Excel tables). Available at http://esa.un.org/wpp/unpp/panel_population.htm.
Categories, topics:
Health, Gender
Last updated:
apr 23, 2017
Indicators value changes by year
Minimum:
60.099
jan 1, 1961
Maximum:
75.402
jan 1, 2015
At the date of observation
Value
Absolute change
Change from previous value
jan 1, 1961
60.099
+60.099
0.0%
jan 1, 1962
60.996
+0.897
1.49%
jan 1, 1963
61.893
+0.897
1.47%
jan 1, 1964
62.37
+0.477
0.77%
jan 1, 1965
62.847
+0.477
0.76%
jan 1, 1966
63.324
+0.477
0.76%
jan 1, 1967
63.801
+0.477
0.75%
jan 1, 1968
64.278
+0.477
0.75%
jan 1, 1969
64.686
+0.407
0.63%
jan 1, 1970
65.093
+0.407
0.63%
jan 1, 1971
65.5
+0.407
0.63%
jan 1, 1972
65.908
+0.407
0.62%
jan 1, 1973
66.315
+0.407
0.62%
jan 1, 1974
66.397
+0.082
0.12%
jan 1, 1975
66.48
+0.082
0.12%
jan 1, 1976
66.562
+0.082
0.12%
jan 1, 1977
66.644
+0.082
0.12%
jan 1, 1978
66.726
+0.082
0.12%
jan 1, 1979
66.923
+0.197
0.3%
jan 1, 1980
67.12
+0.197
0.29%
jan 1, 1981
67.318
+0.197
0.29%
jan 1, 1982
67.515
+0.197
0.29%
jan 1, 1983
67.712
+0.197
0.29%
jan 1, 1984
67.737
+0.025
0.04%
jan 1, 1985
67.762
+0.025
0.04%
jan 1, 1986
67.787
+0.025
0.04%
jan 1, 1987
67.811
+0.025
0.04%
jan 1, 1988
67.836
+0.025
0.04%
jan 1, 1989
68.021
+0.185
0.27%
jan 1, 1990
68.206
+0.185
0.27%
jan 1, 1991
68.391
+0.185
0.27%
jan 1, 1992
68.575
+0.185
0.27%
jan 1, 1993
68.76
+0.185
0.27%
jan 1, 1994
68.804
+0.044
0.06%
jan 1, 1995
68.848
+0.044
0.06%
jan 1, 1996
68.893
+0.044
0.06%
jan 1, 1997
68.937
+0.044
0.06%
jan 1, 1998
68.981
+0.044
0.06%
jan 1, 1999
69.154
+0.173
0.25%
jan 1, 2000
69.327
+0.173
0.25%
jan 1, 2001
69.501
+0.173
0.25%
jan 1, 2002
69.674
+0.173
0.25%
jan 1, 2003
69.847
+0.173
0.25%
jan 1, 2004
70.357
+0.51
0.73%
jan 1, 2005
70.867
+0.51
0.73%
jan 1, 2006
71.378
+0.51
0.72%
jan 1, 2007
71.888
+0.51
0.71%
jan 1, 2008
72.398
+0.51
0.71%
jan 1, 2009
72.893
+0.495
0.68%
jan 1, 2010
73.389
+0.495
0.68%
jan 1, 2011
73.884
+0.495
0.67%
jan 1, 2012
74.379
+0.495
0.67%
jan 1, 2013
74.875
+0.495
0.67%
jan 1, 2014
75.138
+0.263
0.35%
jan 1, 2015
75.402
+0.263
0.35%
Ranking of countries by current statistics by years


Comments: