29
/
en
AIzaSyAYiBZKx7MnpbEhh9jyipgxe19OcubqV5w
April 1, 2024
46701
Low income
LIC
false
2
1
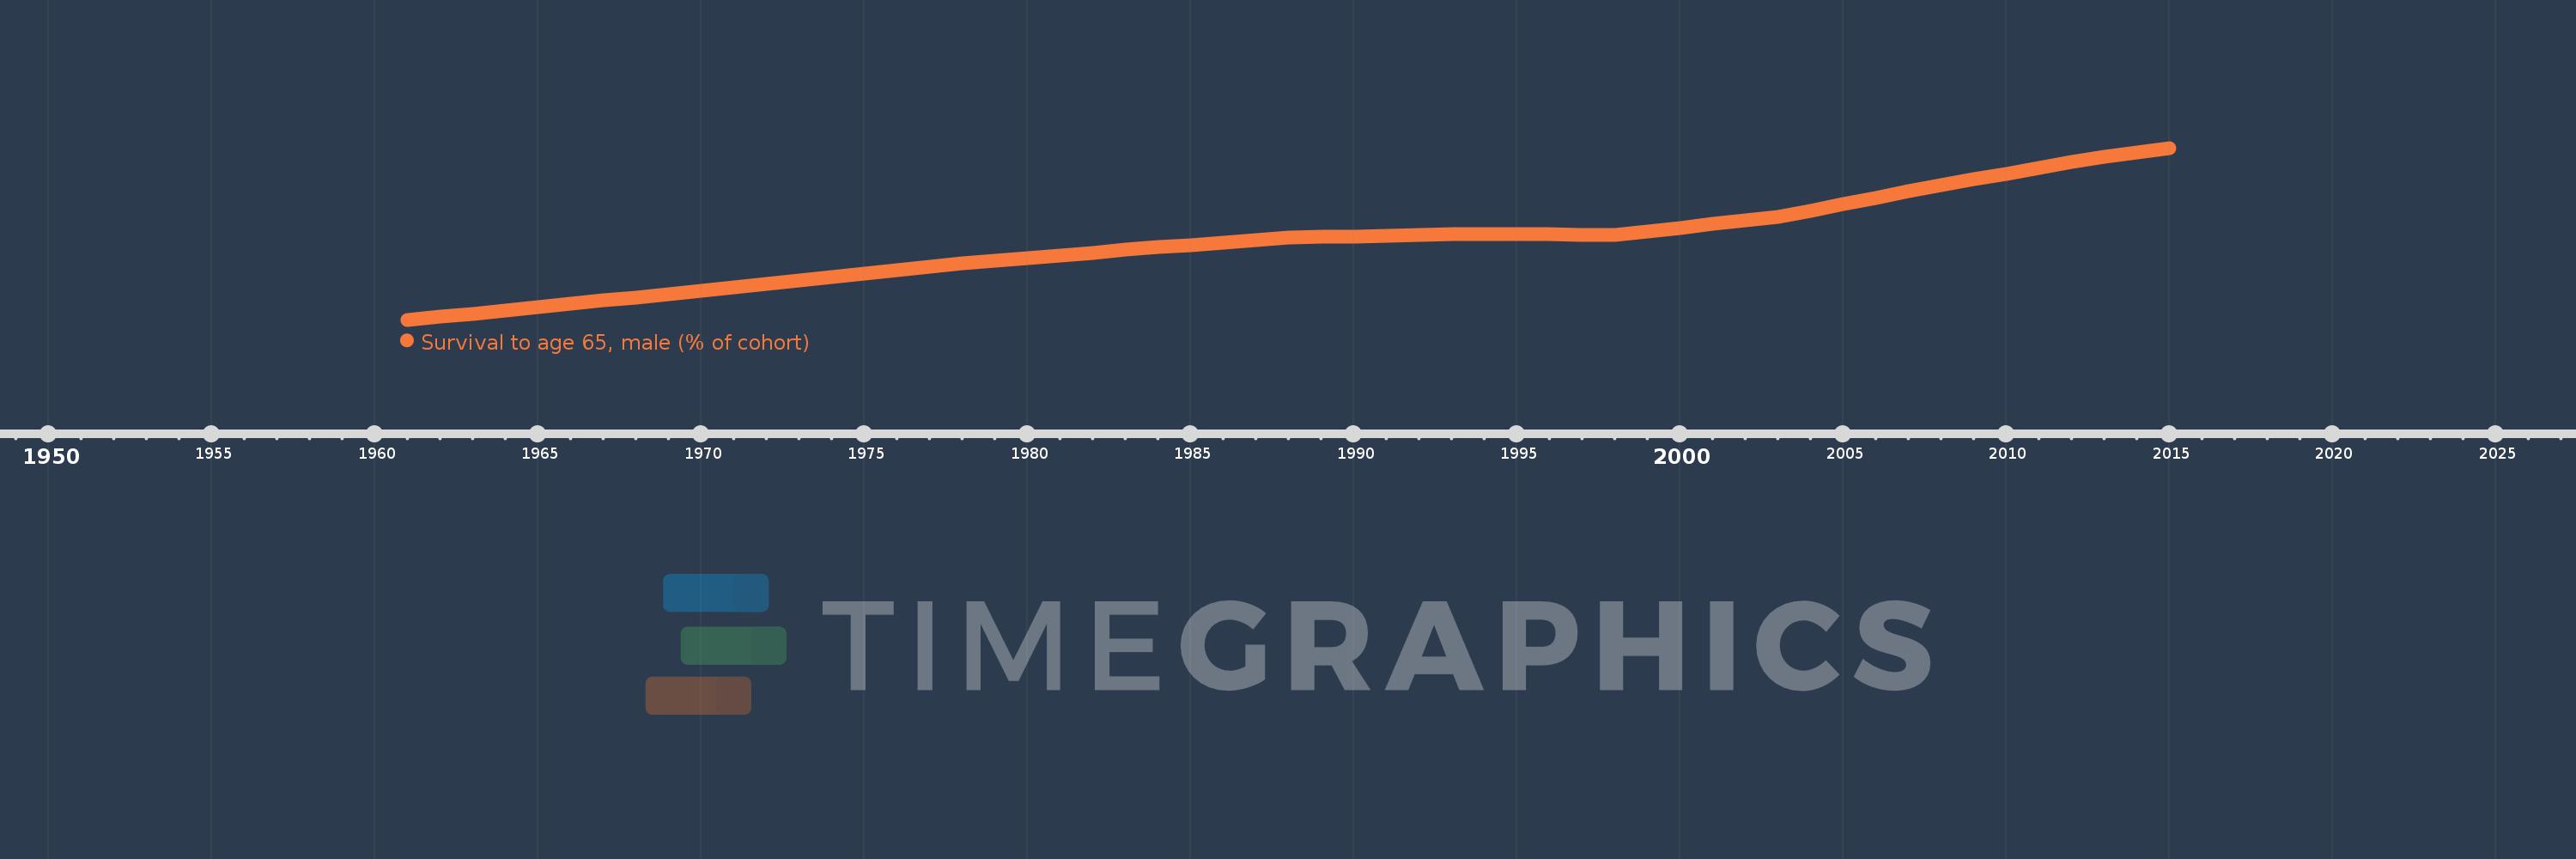
Survival to age 65, male (% of cohort)
2015,2014,2013,2012,2011,2010,2009,2008,2007,2006,2005,2004,2003,2002,2001,2000,1999,1998,1997,1996,1995,1994,1993,1992,1991,1990,1989,1988,1987,1986,1985,1984,1983,1982,1981,1980,1979,1978,1977,1976,1975,1974,1973,1972,1971,1970,1969,1968,1967,1966,1965,1964,1963,1962,1961
This statistics in other country:
AfghanistanAlbaniaAlgeriaAngolaAntigua and BarbudaArab WorldArgentinaArmeniaArubaAustraliaAustriaAzerbaijanBahamas, TheBahrainBangladeshBarbadosBelarusBelgiumBelizeBeninBhutanBoliviaBosnia and HerzegovinaBotswanaBrazilBrunei DarussalamBulgariaBurkina FasoBurundiCabo VerdeCambodiaCameroonCanadaCaribbean small statesCentral African RepublicCentral Europe and the BalticsChadChannel IslandsChileChinaColombiaComorosCongo, Dem. Rep.Congo, Rep.Costa RicaCote d'IvoireCroatiaCubaCuracaoCyprusCzech RepublicDenmarkDjiboutiDominican RepublicEarly-demographic dividendEast Asia & PacificEast Asia & Pacific (excluding high income)East Asia & Pacific (IDA & IBRD countries)EcuadorEgypt, Arab Rep.El SalvadorEquatorial GuineaEritreaEstoniaEthiopiaEuro areaEurope & Central AsiaEurope & Central Asia (excluding high income)Europe & Central Asia (IDA & IBRD countries)European UnionFijiFinlandFragile and conflict affected situationsFranceFrench PolynesiaGabonGambia, TheGeorgiaGermanyGhanaGreeceGrenadaGuamGuatemalaGuineaGuinea-BissauGuyanaHaitiHeavily indebted poor countries (HIPC)High incomeHondurasHong Kong SAR, ChinaHungaryIBRD onlyIcelandIDA & IBRD totalIDA blendIDA onlyIDA totalIndiaIndonesiaIran, Islamic Rep.IraqIrelandIsraelItalyJamaicaJapanJordanKazakhstanKenyaKiribatiKorea, Dem. People’s Rep.Korea, Rep.KuwaitKyrgyz RepublicLao PDRLate-demographic dividendLatin America & Caribbean Latin America & Caribbean (excluding high income)Latin America & the Caribbean (IDA & IBRD countries)LatviaLeast developed countries: UN classificationLebanonLesothoLiberiaLibyaLithuaniaLow & middle incomeLow incomeLower middle incomeLuxembourgMacao SAR, ChinaMacedonia, FYRMadagascarMalawiMalaysiaMaldivesMaliMaltaMauritaniaMauritiusMexicoMicronesia, Fed. Sts.Middle East & North AfricaMiddle East & North Africa (excluding high income)Middle East & North Africa (IDA & IBRD countries)Middle incomeMoldovaMongoliaMontenegroMoroccoMozambiqueMyanmarNamibiaNepalNetherlandsNew CaledoniaNew ZealandNicaraguaNigerNigeriaNorth AmericaNorwayOECD membersOmanOther small statesPacific island small statesPakistanPanamaPapua New GuineaParaguayPeruPhilippinesPolandPortugalPost-demographic dividendPre-demographic dividendPuerto RicoQatarRomaniaRussian FederationRwandaSamoaSao Tome and PrincipeSaudi ArabiaSenegalSerbiaSeychellesSierra LeoneSingaporeSlovak RepublicSloveniaSmall statesSolomon IslandsSomaliaSouth AfricaSouth AsiaSouth Asia (IDA & IBRD)South SudanSpainSri LankaSt. LuciaSt. Vincent and the GrenadinesSub-Saharan Africa Sub-Saharan Africa (excluding high income)Sub-Saharan Africa (IDA & IBRD countries)SudanSurinameSwazilandSwedenSwitzerlandSyrian Arab RepublicTajikistanTanzaniaThailandTimor-LesteTogoTongaTrinidad and TobagoTunisiaTurkeyTurkmenistanUgandaUkraineUnited Arab EmiratesUnited KingdomUnited StatesUpper middle incomeUruguayUzbekistanVanuatuVenezuela, RBVietnamVirgin Islands (U.S.)West Bank and GazaWorldYemen, Rep.ZambiaZimbabwe Timeline:
This timeline shows a graph from 1961 to 2015 of Low income. No data until 1960. Number of actual observations by date: 55.
Source name:
World Development Indicators
Source organization:
United Nations Population Division. World Population Prospects. New York, United Nations, Department of Economic and Social Affairs (advanced Excel tables). Available at http://esa.un.org/wpp/unpp/panel_population.htm.
Categories, topics:
Health, Gender
Last updated:
apr 23, 2017
Indicators value changes by year
Maximum:
56.871
jan 1, 2015
At the date of observation
Value
Absolute change
Change from previous value
jan 1, 1961
26.17
+26.17
0.0%
jan 1, 1962
26.669
+0.499
1.91%
jan 1, 1963
27.176
+0.506
1.9%
jan 1, 1964
27.786
+0.61
2.25%
jan 1, 1965
28.392
+0.606
2.18%
jan 1, 1966
28.988
+0.596
2.1%
jan 1, 1967
29.6
+0.612
2.11%
jan 1, 1968
30.191
+0.591
2.0%
jan 1, 1969
30.788
+0.597
1.98%
jan 1, 1970
31.387
+0.599
1.95%
jan 1, 1971
31.997
+0.61
1.94%
jan 1, 1972
32.606
+0.609
1.9%
jan 1, 1973
33.232
+0.626
1.92%
jan 1, 1974
33.838
+0.605
1.82%
jan 1, 1975
34.437
+0.6
1.77%
jan 1, 1976
35.025
+0.587
1.7%
jan 1, 1977
35.615
+0.59
1.68%
jan 1, 1978
36.195
+0.581
1.63%
jan 1, 1979
36.663
+0.468
1.29%
jan 1, 1980
37.136
+0.473
1.29%
jan 1, 1981
37.618
+0.482
1.3%
jan 1, 1982
38.134
+0.515
1.37%
jan 1, 1983
38.641
+0.507
1.33%
jan 1, 1984
39.097
+0.455
1.18%
jan 1, 1985
39.546
+0.449
1.15%
jan 1, 1986
39.989
+0.444
1.12%
jan 1, 1987
40.416
+0.427
1.07%
jan 1, 1988
40.842
+0.426
1.05%
jan 1, 1989
40.97
+0.127
0.31%
jan 1, 1990
41.079
+0.11
0.27%
jan 1, 1991
41.177
+0.097
0.24%
jan 1, 1992
41.306
+0.13
0.32%
jan 1, 1993
41.447
+0.141
0.34%
jan 1, 1994
41.445
-0.002
-0.01%
jan 1, 1995
41.432
-0.013
-0.03%
jan 1, 1996
41.408
-0.024
-0.06%
jan 1, 1997
41.372
-0.036
-0.09%
jan 1, 1998
41.331
-0.041
-0.1%
jan 1, 1999
41.975
+0.644
1.56%
jan 1, 2000
42.615
+0.64
1.52%
jan 1, 2001
43.255
+0.64
1.5%
jan 1, 2002
43.903
+0.648
1.5%
jan 1, 2003
44.551
+0.648
1.48%
jan 1, 2004
45.684
+1.133
2.54%
jan 1, 2005
46.816
+1.132
2.48%
jan 1, 2006
47.947
+1.131
2.42%
jan 1, 2007
49.082
+1.135
2.37%
jan 1, 2008
50.217
+1.136
2.31%
jan 1, 2009
51.237
+1.02
2.03%
jan 1, 2010
52.257
+1.019
1.99%
jan 1, 2011
53.276
+1.019
1.95%
jan 1, 2012
54.304
+1.028
1.93%
jan 1, 2013
55.331
+1.027
1.89%
jan 1, 2014
56.101
+0.77
1.39%
jan 1, 2015
56.871
+0.77
1.37%
Ranking of countries by current statistics by years


Comments: