29
/
en
AIzaSyAYiBZKx7MnpbEhh9jyipgxe19OcubqV5w
April 1, 2024
55912
Pre-demographic dividend
PRE
false
2
1
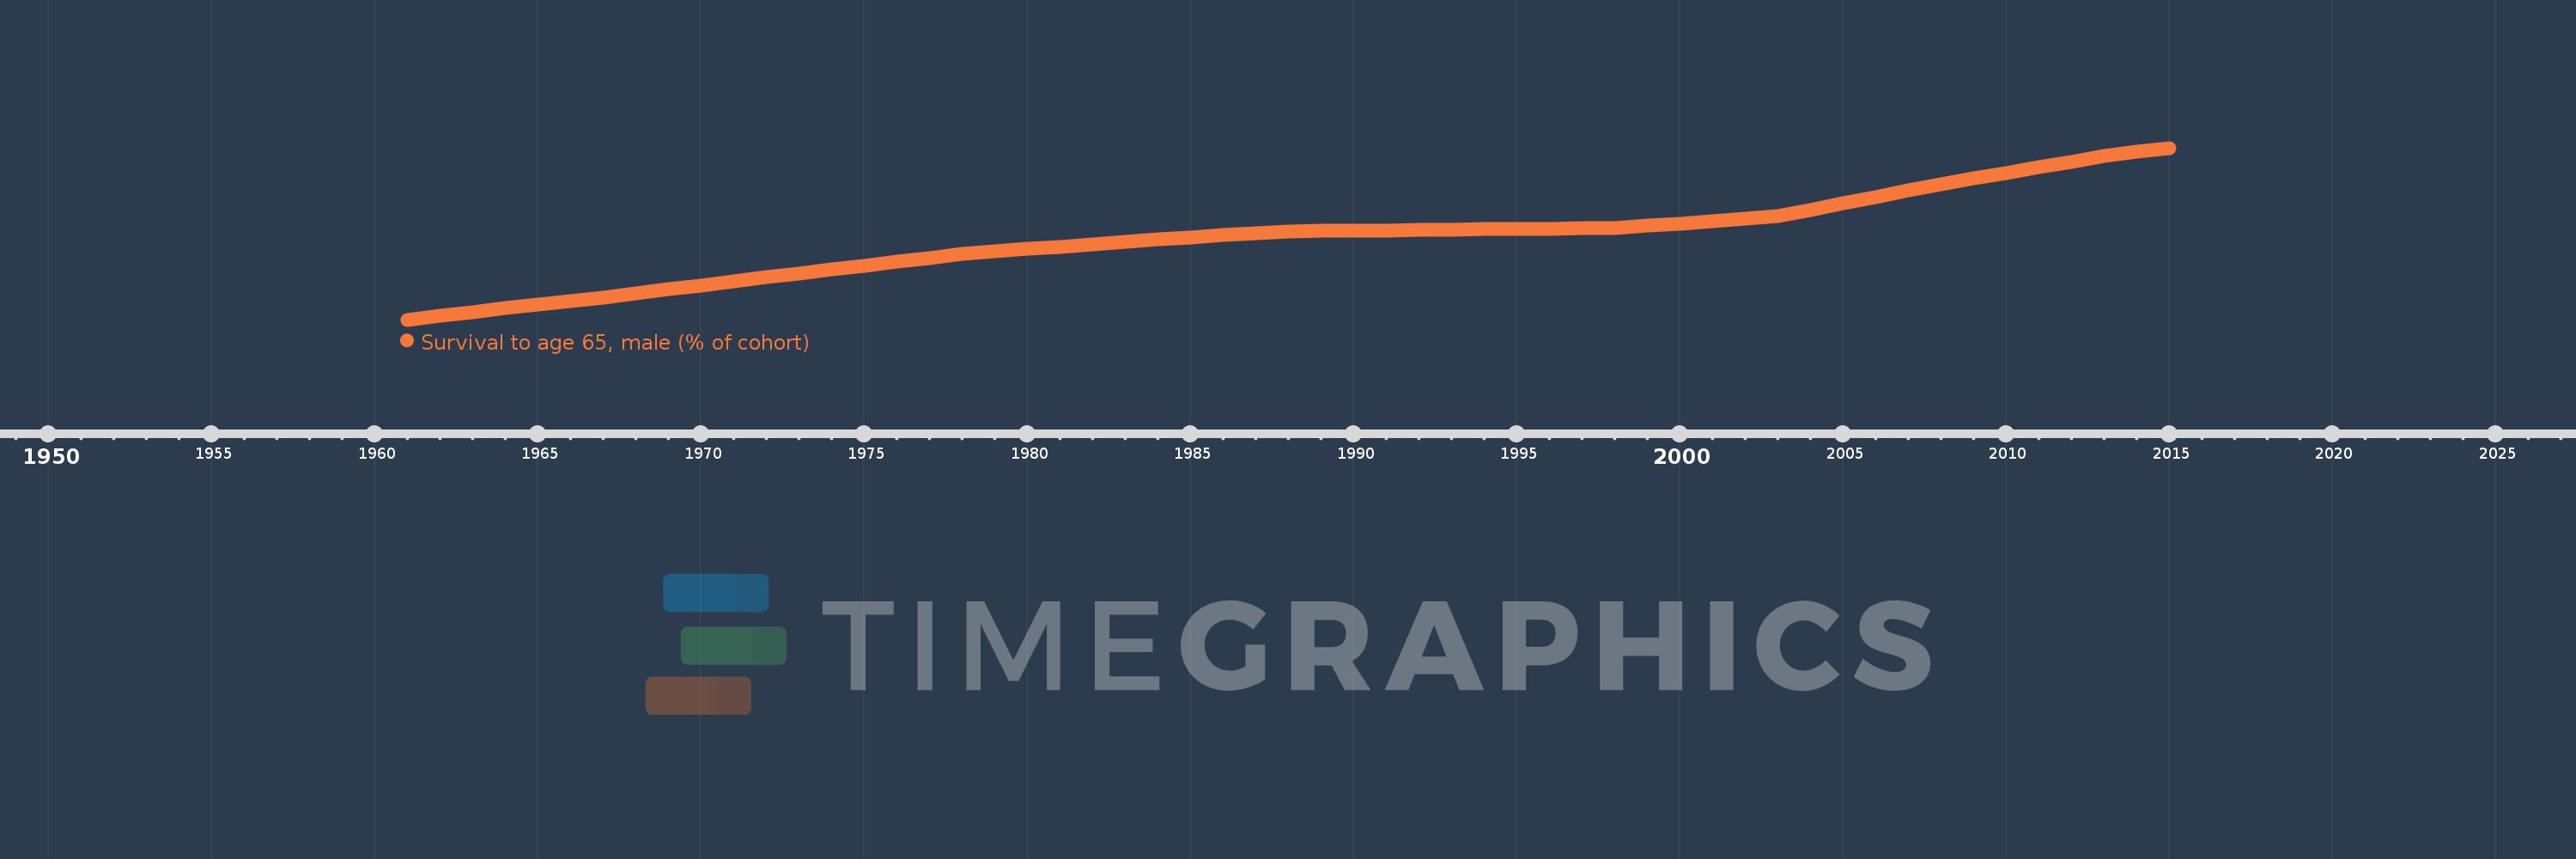
Survival to age 65, male (% of cohort)
2015,2014,2013,2012,2011,2010,2009,2008,2007,2006,2005,2004,2003,2002,2001,2000,1999,1998,1997,1996,1995,1994,1993,1992,1991,1990,1989,1988,1987,1986,1985,1984,1983,1982,1981,1980,1979,1978,1977,1976,1975,1974,1973,1972,1971,1970,1969,1968,1967,1966,1965,1964,1963,1962,1961
This statistics in other country:
AfghanistanAlbaniaAlgeriaAngolaAntigua and BarbudaArab WorldArgentinaArmeniaArubaAustraliaAustriaAzerbaijanBahamas, TheBahrainBangladeshBarbadosBelarusBelgiumBelizeBeninBhutanBoliviaBosnia and HerzegovinaBotswanaBrazilBrunei DarussalamBulgariaBurkina FasoBurundiCabo VerdeCambodiaCameroonCanadaCaribbean small statesCentral African RepublicCentral Europe and the BalticsChadChannel IslandsChileChinaColombiaComorosCongo, Dem. Rep.Congo, Rep.Costa RicaCote d'IvoireCroatiaCubaCuracaoCyprusCzech RepublicDenmarkDjiboutiDominican RepublicEarly-demographic dividendEast Asia & PacificEast Asia & Pacific (excluding high income)East Asia & Pacific (IDA & IBRD countries)EcuadorEgypt, Arab Rep.El SalvadorEquatorial GuineaEritreaEstoniaEthiopiaEuro areaEurope & Central AsiaEurope & Central Asia (excluding high income)Europe & Central Asia (IDA & IBRD countries)European UnionFijiFinlandFragile and conflict affected situationsFranceFrench PolynesiaGabonGambia, TheGeorgiaGermanyGhanaGreeceGrenadaGuamGuatemalaGuineaGuinea-BissauGuyanaHaitiHeavily indebted poor countries (HIPC)High incomeHondurasHong Kong SAR, ChinaHungaryIBRD onlyIcelandIDA & IBRD totalIDA blendIDA onlyIDA totalIndiaIndonesiaIran, Islamic Rep.IraqIrelandIsraelItalyJamaicaJapanJordanKazakhstanKenyaKiribatiKorea, Dem. People’s Rep.Korea, Rep.KuwaitKyrgyz RepublicLao PDRLate-demographic dividendLatin America & Caribbean Latin America & Caribbean (excluding high income)Latin America & the Caribbean (IDA & IBRD countries)LatviaLeast developed countries: UN classificationLebanonLesothoLiberiaLibyaLithuaniaLow & middle incomeLow incomeLower middle incomeLuxembourgMacao SAR, ChinaMacedonia, FYRMadagascarMalawiMalaysiaMaldivesMaliMaltaMauritaniaMauritiusMexicoMicronesia, Fed. Sts.Middle East & North AfricaMiddle East & North Africa (excluding high income)Middle East & North Africa (IDA & IBRD countries)Middle incomeMoldovaMongoliaMontenegroMoroccoMozambiqueMyanmarNamibiaNepalNetherlandsNew CaledoniaNew ZealandNicaraguaNigerNigeriaNorth AmericaNorwayOECD membersOmanOther small statesPacific island small statesPakistanPanamaPapua New GuineaParaguayPeruPhilippinesPolandPortugalPost-demographic dividendPre-demographic dividendPuerto RicoQatarRomaniaRussian FederationRwandaSamoaSao Tome and PrincipeSaudi ArabiaSenegalSerbiaSeychellesSierra LeoneSingaporeSlovak RepublicSloveniaSmall statesSolomon IslandsSomaliaSouth AfricaSouth AsiaSouth Asia (IDA & IBRD)South SudanSpainSri LankaSt. LuciaSt. Vincent and the GrenadinesSub-Saharan Africa Sub-Saharan Africa (excluding high income)Sub-Saharan Africa (IDA & IBRD countries)SudanSurinameSwazilandSwedenSwitzerlandSyrian Arab RepublicTajikistanTanzaniaThailandTimor-LesteTogoTongaTrinidad and TobagoTunisiaTurkeyTurkmenistanUgandaUkraineUnited Arab EmiratesUnited KingdomUnited StatesUpper middle incomeUruguayUzbekistanVanuatuVenezuela, RBVietnamVirgin Islands (U.S.)West Bank and GazaWorldYemen, Rep.ZambiaZimbabwe Timeline:
This timeline shows a graph from 1961 to 2015 of Pre-demographic dividend. No data until 1960. Number of actual observations by date: 55.
Source name:
World Development Indicators
Source organization:
United Nations Population Division. World Population Prospects. New York, United Nations, Department of Economic and Social Affairs (advanced Excel tables). Available at http://esa.un.org/wpp/unpp/panel_population.htm.
Categories, topics:
Health, Gender
Last updated:
apr 23, 2017
Indicators value changes by year
Minimum:
26.753
jan 1, 1961
Maximum:
52.435
jan 1, 2015
At the date of observation
Value
Absolute change
Change from previous value
jan 1, 1961
26.753
+26.753
0.0%
jan 1, 1962
27.335
+0.582
2.18%
jan 1, 1963
27.912
+0.576
2.11%
jan 1, 1964
28.455
+0.544
1.95%
jan 1, 1965
29.0
+0.545
1.92%
jan 1, 1966
29.549
+0.549
1.89%
jan 1, 1967
30.106
+0.556
1.88%
jan 1, 1968
30.665
+0.56
1.86%
jan 1, 1969
31.277
+0.612
1.99%
jan 1, 1970
31.885
+0.608
1.94%
jan 1, 1971
32.488
+0.603
1.89%
jan 1, 1972
33.093
+0.605
1.86%
jan 1, 1973
33.695
+0.603
1.82%
jan 1, 1974
34.278
+0.583
1.73%
jan 1, 1975
34.859
+0.581
1.69%
jan 1, 1976
35.438
+0.579
1.66%
jan 1, 1977
36.023
+0.585
1.65%
jan 1, 1978
36.604
+0.581
1.61%
jan 1, 1979
36.957
+0.353
0.96%
jan 1, 1980
37.311
+0.353
0.96%
jan 1, 1981
37.665
+0.355
0.95%
jan 1, 1982
38.029
+0.364
0.97%
jan 1, 1983
38.394
+0.364
0.96%
jan 1, 1984
38.724
+0.331
0.86%
jan 1, 1985
39.05
+0.325
0.84%
jan 1, 1986
39.368
+0.318
0.81%
jan 1, 1987
39.684
+0.316
0.8%
jan 1, 1988
39.99
+0.307
0.77%
jan 1, 1989
40.04
+0.049
0.12%
jan 1, 1990
40.084
+0.045
0.11%
jan 1, 1991
40.129
+0.045
0.11%
jan 1, 1992
40.19
+0.061
0.15%
jan 1, 1993
40.261
+0.071
0.18%
jan 1, 1994
40.313
+0.052
0.13%
jan 1, 1995
40.357
+0.044
0.11%
jan 1, 1996
40.39
+0.033
0.08%
jan 1, 1997
40.417
+0.028
0.07%
jan 1, 1998
40.435
+0.018
0.04%
jan 1, 1999
40.794
+0.359
0.89%
jan 1, 2000
41.15
+0.355
0.87%
jan 1, 2001
41.505
+0.355
0.86%
jan 1, 2002
41.868
+0.363
0.88%
jan 1, 2003
42.235
+0.367
0.88%
jan 1, 2004
43.197
+0.962
2.28%
jan 1, 2005
44.156
+0.958
2.22%
jan 1, 2006
45.11
+0.954
2.16%
jan 1, 2007
46.063
+0.953
2.11%
jan 1, 2008
47.013
+0.951
2.06%
jan 1, 2009
47.853
+0.839
1.78%
jan 1, 2010
48.692
+0.84
1.75%
jan 1, 2011
49.533
+0.841
1.73%
jan 1, 2012
50.381
+0.848
1.71%
jan 1, 2013
51.23
+0.848
1.68%
jan 1, 2014
51.833
+0.603
1.18%
jan 1, 2015
52.435
+0.602
1.16%
Ranking of countries by current statistics by years


Comments: