29
/
en
AIzaSyAYiBZKx7MnpbEhh9jyipgxe19OcubqV5w
April 1, 2024
83507
Belize
BLZ
true
2
1
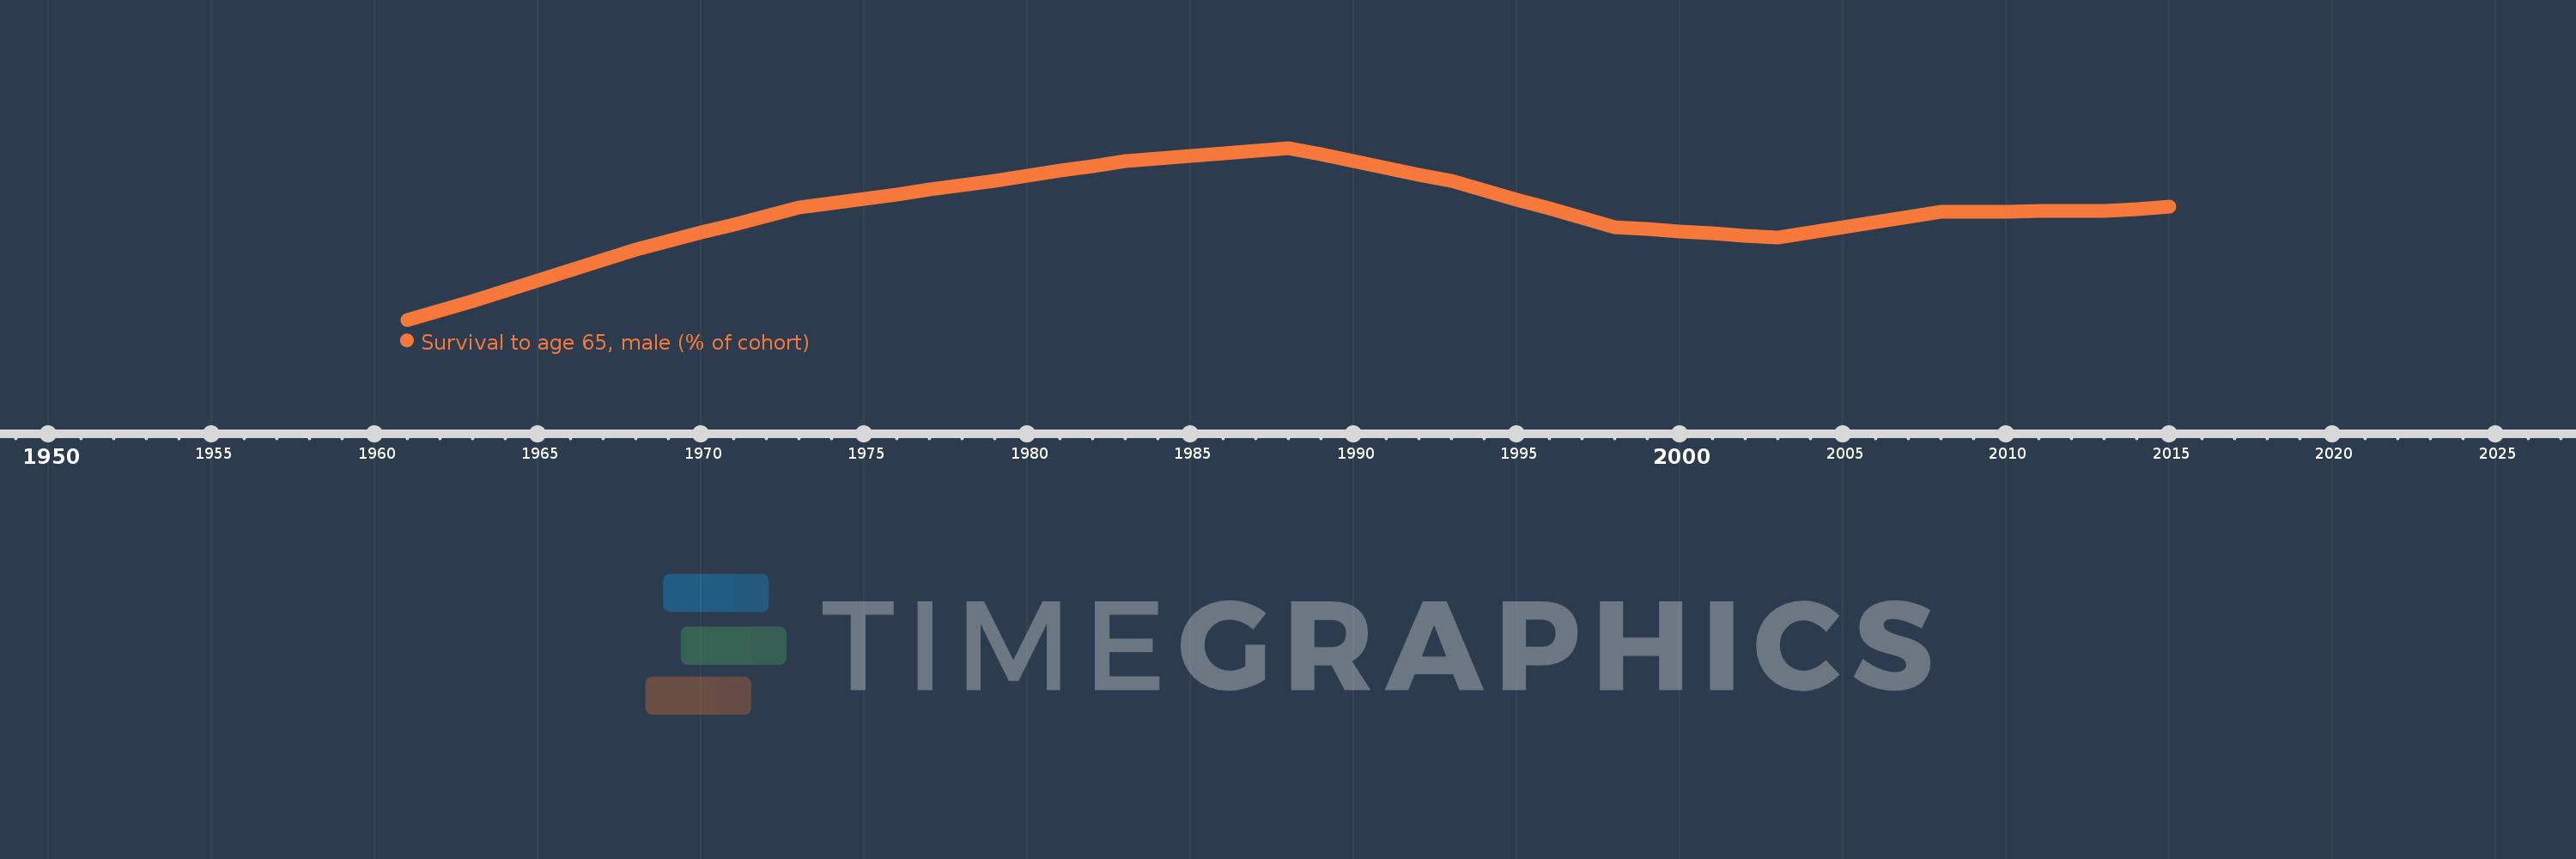
Survival to age 65, male (% of cohort)
2015,2014,2013,2012,2011,2010,2009,2008,2007,2006,2005,2004,2003,2002,2001,2000,1999,1998,1997,1996,1995,1994,1993,1992,1991,1990,1989,1988,1987,1986,1985,1984,1983,1982,1981,1980,1979,1978,1977,1976,1975,1974,1973,1972,1971,1970,1969,1968,1967,1966,1965,1964,1963,1962,1961
This statistics in other country:
AfghanistanAlbaniaAlgeriaAngolaAntigua and BarbudaArab WorldArgentinaArmeniaArubaAustraliaAustriaAzerbaijanBahamas, TheBahrainBangladeshBarbadosBelarusBelgiumBelizeBeninBhutanBoliviaBosnia and HerzegovinaBotswanaBrazilBrunei DarussalamBulgariaBurkina FasoBurundiCabo VerdeCambodiaCameroonCanadaCaribbean small statesCentral African RepublicCentral Europe and the BalticsChadChannel IslandsChileChinaColombiaComorosCongo, Dem. Rep.Congo, Rep.Costa RicaCote d'IvoireCroatiaCubaCuracaoCyprusCzech RepublicDenmarkDjiboutiDominican RepublicEarly-demographic dividendEast Asia & PacificEast Asia & Pacific (excluding high income)East Asia & Pacific (IDA & IBRD countries)EcuadorEgypt, Arab Rep.El SalvadorEquatorial GuineaEritreaEstoniaEthiopiaEuro areaEurope & Central AsiaEurope & Central Asia (excluding high income)Europe & Central Asia (IDA & IBRD countries)European UnionFijiFinlandFragile and conflict affected situationsFranceFrench PolynesiaGabonGambia, TheGeorgiaGermanyGhanaGreeceGrenadaGuamGuatemalaGuineaGuinea-BissauGuyanaHaitiHeavily indebted poor countries (HIPC)High incomeHondurasHong Kong SAR, ChinaHungaryIBRD onlyIcelandIDA & IBRD totalIDA blendIDA onlyIDA totalIndiaIndonesiaIran, Islamic Rep.IraqIrelandIsraelItalyJamaicaJapanJordanKazakhstanKenyaKiribatiKorea, Dem. People’s Rep.Korea, Rep.KuwaitKyrgyz RepublicLao PDRLate-demographic dividendLatin America & Caribbean Latin America & Caribbean (excluding high income)Latin America & the Caribbean (IDA & IBRD countries)LatviaLeast developed countries: UN classificationLebanonLesothoLiberiaLibyaLithuaniaLow & middle incomeLow incomeLower middle incomeLuxembourgMacao SAR, ChinaMacedonia, FYRMadagascarMalawiMalaysiaMaldivesMaliMaltaMauritaniaMauritiusMexicoMicronesia, Fed. Sts.Middle East & North AfricaMiddle East & North Africa (excluding high income)Middle East & North Africa (IDA & IBRD countries)Middle incomeMoldovaMongoliaMontenegroMoroccoMozambiqueMyanmarNamibiaNepalNetherlandsNew CaledoniaNew ZealandNicaraguaNigerNigeriaNorth AmericaNorwayOECD membersOmanOther small statesPacific island small statesPakistanPanamaPapua New GuineaParaguayPeruPhilippinesPolandPortugalPost-demographic dividendPre-demographic dividendPuerto RicoQatarRomaniaRussian FederationRwandaSamoaSao Tome and PrincipeSaudi ArabiaSenegalSerbiaSeychellesSierra LeoneSingaporeSlovak RepublicSloveniaSmall statesSolomon IslandsSomaliaSouth AfricaSouth AsiaSouth Asia (IDA & IBRD)South SudanSpainSri LankaSt. LuciaSt. Vincent and the GrenadinesSub-Saharan Africa Sub-Saharan Africa (excluding high income)Sub-Saharan Africa (IDA & IBRD countries)SudanSurinameSwazilandSwedenSwitzerlandSyrian Arab RepublicTajikistanTanzaniaThailandTimor-LesteTogoTongaTrinidad and TobagoTunisiaTurkeyTurkmenistanUgandaUkraineUnited Arab EmiratesUnited KingdomUnited StatesUpper middle incomeUruguayUzbekistanVanuatuVenezuela, RBVietnamVirgin Islands (U.S.)West Bank and GazaWorldYemen, Rep.ZambiaZimbabwe Timeline:
This timeline shows a graph from 1961 to 2015 of Belize. No data until 1960. Number of actual observations by date: 55.
Source name:
World Development Indicators
Source organization:
United Nations Population Division. World Population Prospects. New York, United Nations, Department of Economic and Social Affairs (advanced Excel tables). Available at http://esa.un.org/wpp/unpp/panel_population.htm.
Categories, topics:
Health, Gender
Last updated:
apr 23, 2017
Indicators value changes by year
Minimum:
55.493
jan 1, 1961
Maximum:
72.309
jan 1, 1988
At the date of observation
Value
Absolute change
Change from previous value
jan 1, 1961
55.493
+55.493
0.0%
jan 1, 1962
56.412
+0.918
1.65%
jan 1, 1963
57.33
+0.918
1.63%
jan 1, 1964
58.344
+1.014
1.77%
jan 1, 1965
59.358
+1.014
1.74%
jan 1, 1966
60.371
+1.014
1.71%
jan 1, 1967
61.385
+1.014
1.68%
jan 1, 1968
62.399
+1.014
1.65%
jan 1, 1969
63.211
+0.812
1.3%
jan 1, 1970
64.023
+0.812
1.28%
jan 1, 1971
64.835
+0.812
1.27%
jan 1, 1972
65.647
+0.812
1.25%
jan 1, 1973
66.459
+0.812
1.24%
jan 1, 1974
66.898
+0.439
0.66%
jan 1, 1975
67.337
+0.439
0.66%
jan 1, 1976
67.776
+0.439
0.65%
jan 1, 1977
68.215
+0.439
0.65%
jan 1, 1978
68.654
+0.439
0.64%
jan 1, 1979
69.127
+0.472
0.69%
jan 1, 1980
69.599
+0.472
0.68%
jan 1, 1981
70.071
+0.472
0.68%
jan 1, 1982
70.544
+0.472
0.67%
jan 1, 1983
71.016
+0.472
0.67%
jan 1, 1984
71.274
+0.259
0.36%
jan 1, 1985
71.533
+0.259
0.36%
jan 1, 1986
71.792
+0.259
0.36%
jan 1, 1987
72.05
+0.259
0.36%
jan 1, 1988
72.309
+0.259
0.36%
jan 1, 1989
71.66
-0.648
-0.9%
jan 1, 1990
71.012
-0.648
-0.9%
jan 1, 1991
70.364
-0.648
-0.91%
jan 1, 1992
69.715
-0.648
-0.92%
jan 1, 1993
69.067
-0.648
-0.93%
jan 1, 1994
68.163
-0.903
-1.31%
jan 1, 1995
67.26
-0.903
-1.33%
jan 1, 1996
66.357
-0.903
-1.34%
jan 1, 1997
65.454
-0.903
-1.36%
jan 1, 1998
64.551
-0.903
-1.38%
jan 1, 1999
64.341
-0.209
-0.32%
jan 1, 2000
64.132
-0.209
-0.33%
jan 1, 2001
63.923
-0.209
-0.33%
jan 1, 2002
63.713
-0.209
-0.33%
jan 1, 2003
63.504
-0.209
-0.33%
jan 1, 2004
64.013
+0.509
0.8%
jan 1, 2005
64.522
+0.509
0.8%
jan 1, 2006
65.031
+0.509
0.79%
jan 1, 2007
65.54
+0.509
0.78%
jan 1, 2008
66.049
+0.509
0.78%
jan 1, 2009
66.069
+0.02
0.03%
jan 1, 2010
66.089
+0.02
0.03%
jan 1, 2011
66.109
+0.02
0.03%
jan 1, 2012
66.128
+0.02
0.03%
jan 1, 2013
66.148
+0.02
0.03%
jan 1, 2014
66.345
+0.197
0.3%
jan 1, 2015
66.542
+0.197
0.3%
Ranking of countries by current statistics by years


Comments: