29
/
en
AIzaSyAYiBZKx7MnpbEhh9jyipgxe19OcubqV5w
April 1, 2024
276200
United Kingdom
GBR
true
2
1
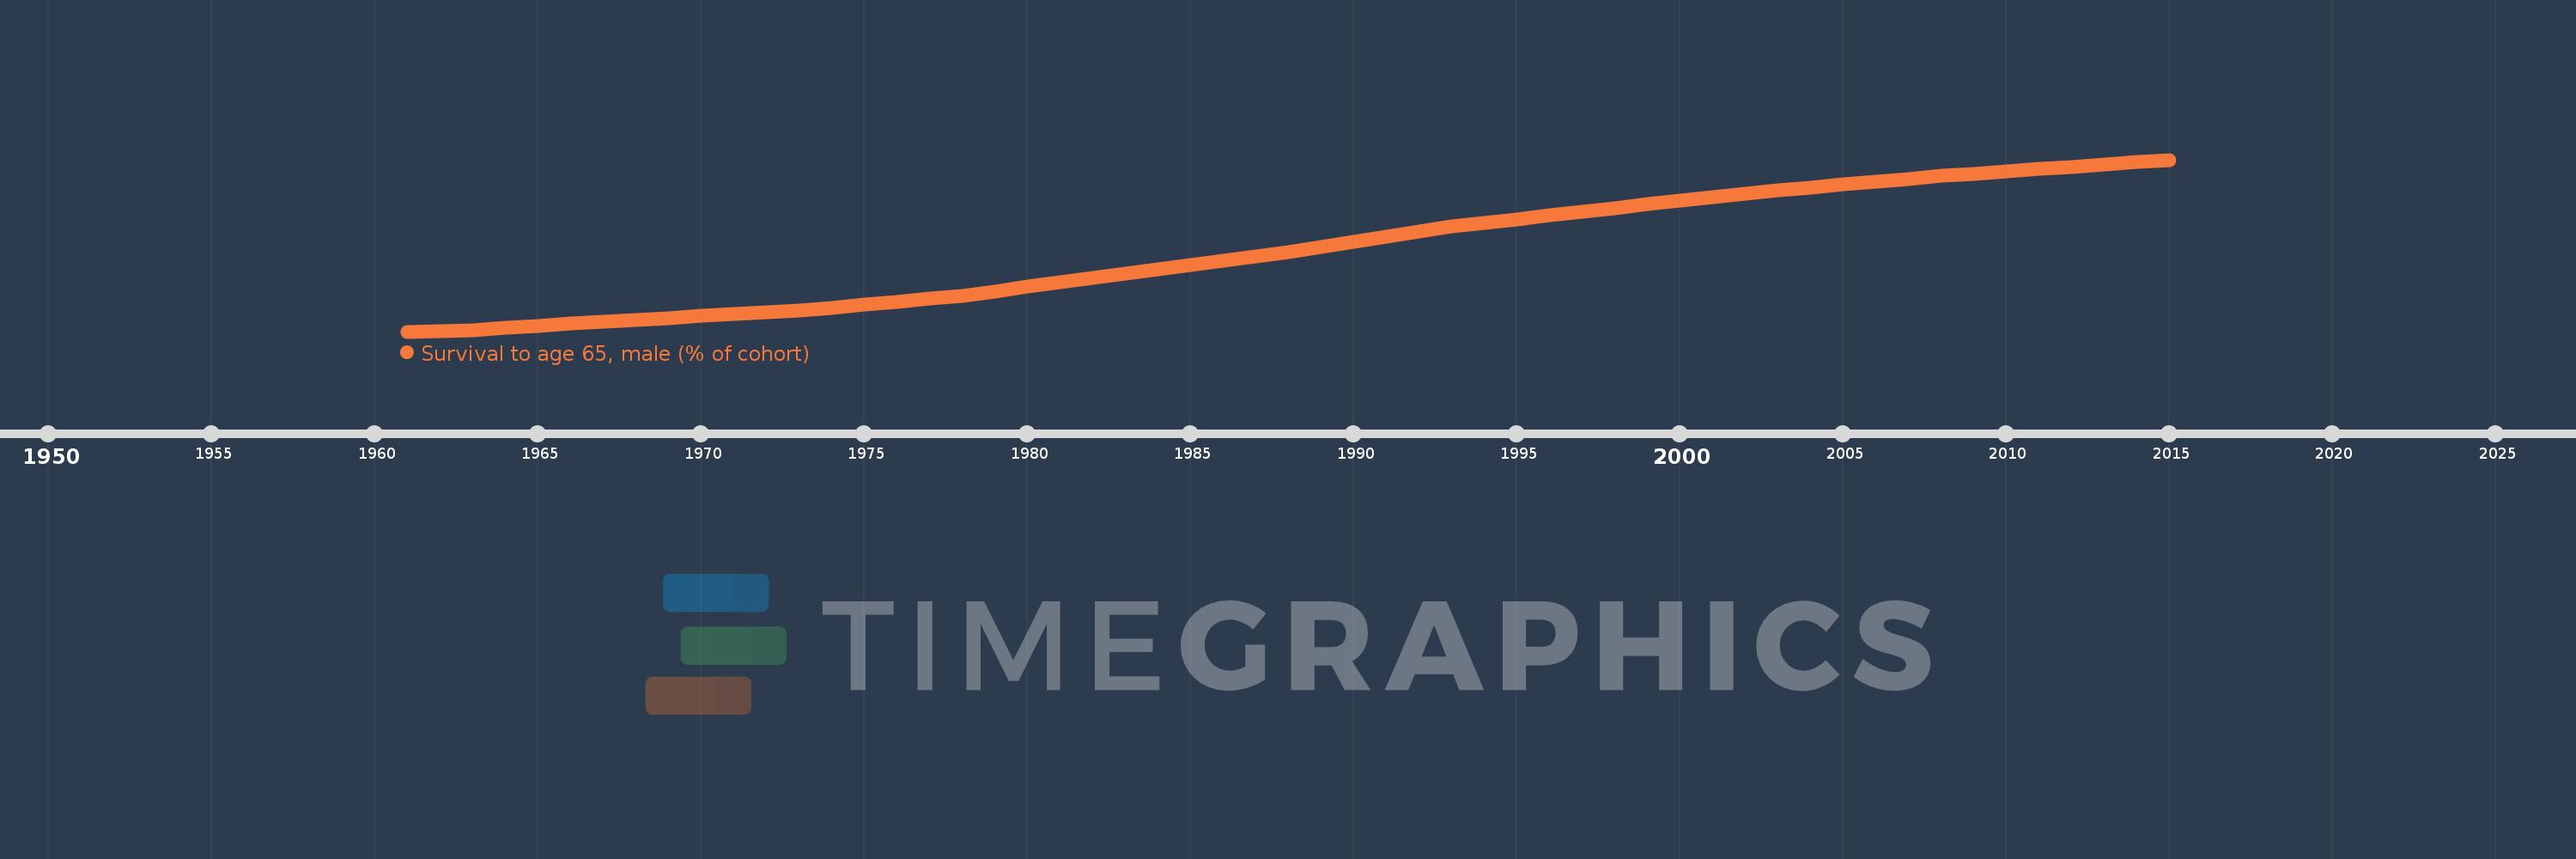
Survival to age 65, male (% of cohort)
2015,2014,2013,2012,2011,2010,2009,2008,2007,2006,2005,2004,2003,2002,2001,2000,1999,1998,1997,1996,1995,1994,1993,1992,1991,1990,1989,1988,1987,1986,1985,1984,1983,1982,1981,1980,1979,1978,1977,1976,1975,1974,1973,1972,1971,1970,1969,1968,1967,1966,1965,1964,1963,1962,1961
This statistics in other country:
AfghanistanAlbaniaAlgeriaAngolaAntigua and BarbudaArab WorldArgentinaArmeniaArubaAustraliaAustriaAzerbaijanBahamas, TheBahrainBangladeshBarbadosBelarusBelgiumBelizeBeninBhutanBoliviaBosnia and HerzegovinaBotswanaBrazilBrunei DarussalamBulgariaBurkina FasoBurundiCabo VerdeCambodiaCameroonCanadaCaribbean small statesCentral African RepublicCentral Europe and the BalticsChadChannel IslandsChileChinaColombiaComorosCongo, Dem. Rep.Congo, Rep.Costa RicaCote d'IvoireCroatiaCubaCuracaoCyprusCzech RepublicDenmarkDjiboutiDominican RepublicEarly-demographic dividendEast Asia & PacificEast Asia & Pacific (excluding high income)East Asia & Pacific (IDA & IBRD countries)EcuadorEgypt, Arab Rep.El SalvadorEquatorial GuineaEritreaEstoniaEthiopiaEuro areaEurope & Central AsiaEurope & Central Asia (excluding high income)Europe & Central Asia (IDA & IBRD countries)European UnionFijiFinlandFragile and conflict affected situationsFranceFrench PolynesiaGabonGambia, TheGeorgiaGermanyGhanaGreeceGrenadaGuamGuatemalaGuineaGuinea-BissauGuyanaHaitiHeavily indebted poor countries (HIPC)High incomeHondurasHong Kong SAR, ChinaHungaryIBRD onlyIcelandIDA & IBRD totalIDA blendIDA onlyIDA totalIndiaIndonesiaIran, Islamic Rep.IraqIrelandIsraelItalyJamaicaJapanJordanKazakhstanKenyaKiribatiKorea, Dem. People’s Rep.Korea, Rep.KuwaitKyrgyz RepublicLao PDRLate-demographic dividendLatin America & Caribbean Latin America & Caribbean (excluding high income)Latin America & the Caribbean (IDA & IBRD countries)LatviaLeast developed countries: UN classificationLebanonLesothoLiberiaLibyaLithuaniaLow & middle incomeLow incomeLower middle incomeLuxembourgMacao SAR, ChinaMacedonia, FYRMadagascarMalawiMalaysiaMaldivesMaliMaltaMauritaniaMauritiusMexicoMicronesia, Fed. Sts.Middle East & North AfricaMiddle East & North Africa (excluding high income)Middle East & North Africa (IDA & IBRD countries)Middle incomeMoldovaMongoliaMontenegroMoroccoMozambiqueMyanmarNamibiaNepalNetherlandsNew CaledoniaNew ZealandNicaraguaNigerNigeriaNorth AmericaNorwayOECD membersOmanOther small statesPacific island small statesPakistanPanamaPapua New GuineaParaguayPeruPhilippinesPolandPortugalPost-demographic dividendPre-demographic dividendPuerto RicoQatarRomaniaRussian FederationRwandaSamoaSao Tome and PrincipeSaudi ArabiaSenegalSerbiaSeychellesSierra LeoneSingaporeSlovak RepublicSloveniaSmall statesSolomon IslandsSomaliaSouth AfricaSouth AsiaSouth Asia (IDA & IBRD)South SudanSpainSri LankaSt. LuciaSt. Vincent and the GrenadinesSub-Saharan Africa Sub-Saharan Africa (excluding high income)Sub-Saharan Africa (IDA & IBRD countries)SudanSurinameSwazilandSwedenSwitzerlandSyrian Arab RepublicTajikistanTanzaniaThailandTimor-LesteTogoTongaTrinidad and TobagoTunisiaTurkeyTurkmenistanUgandaUkraineUnited Arab EmiratesUnited KingdomUnited StatesUpper middle incomeUruguayUzbekistanVanuatuVenezuela, RBVietnamVirgin Islands (U.S.)West Bank and GazaWorldYemen, Rep.ZambiaZimbabwe Timeline:
This timeline shows a graph from 1961 to 2015 of United Kingdom. No data until 1960. Number of actual observations by date: 55.
Source name:
World Development Indicators
Source organization:
United Nations Population Division. World Population Prospects. New York, United Nations, Department of Economic and Social Affairs (advanced Excel tables). Available at http://esa.un.org/wpp/unpp/panel_population.htm.
Categories, topics:
Health, Gender
Last updated:
apr 23, 2017
Indicators value changes by year
Maximum:
86.475
jan 1, 2015
At the date of observation
Value
Absolute change
Change from previous value
jan 1, 1961
67.95
+67.95
0.0%
jan 1, 1962
68.039
+0.088
0.13%
jan 1, 1963
68.127
+0.088
0.13%
jan 1, 1964
68.348
+0.221
0.32%
jan 1, 1965
68.569
+0.221
0.32%
jan 1, 1966
68.789
+0.221
0.32%
jan 1, 1967
69.01
+0.221
0.32%
jan 1, 1968
69.231
+0.221
0.32%
jan 1, 1969
69.43
+0.199
0.29%
jan 1, 1970
69.63
+0.199
0.29%
jan 1, 1971
69.829
+0.199
0.29%
jan 1, 1972
70.029
+0.199
0.29%
jan 1, 1973
70.228
+0.199
0.28%
jan 1, 1974
70.541
+0.313
0.45%
jan 1, 1975
70.854
+0.313
0.44%
jan 1, 1976
71.167
+0.313
0.44%
jan 1, 1977
71.48
+0.313
0.44%
jan 1, 1978
71.793
+0.313
0.44%
jan 1, 1979
72.283
+0.49
0.68%
jan 1, 1980
72.773
+0.49
0.68%
jan 1, 1981
73.263
+0.49
0.67%
jan 1, 1982
73.752
+0.49
0.67%
jan 1, 1983
74.242
+0.49
0.66%
jan 1, 1984
74.698
+0.456
0.61%
jan 1, 1985
75.154
+0.456
0.61%
jan 1, 1986
75.61
+0.456
0.61%
jan 1, 1987
76.066
+0.456
0.6%
jan 1, 1988
76.522
+0.456
0.6%
jan 1, 1989
77.068
+0.546
0.71%
jan 1, 1990
77.614
+0.546
0.71%
jan 1, 1991
78.16
+0.546
0.7%
jan 1, 1992
78.706
+0.546
0.7%
jan 1, 1993
79.252
+0.546
0.69%
jan 1, 1994
79.657
+0.406
0.51%
jan 1, 1995
80.063
+0.406
0.51%
jan 1, 1996
80.469
+0.406
0.51%
jan 1, 1997
80.874
+0.406
0.5%
jan 1, 1998
81.28
+0.406
0.5%
jan 1, 1999
81.661
+0.381
0.47%
jan 1, 2000
82.042
+0.381
0.47%
jan 1, 2001
82.423
+0.381
0.46%
jan 1, 2002
82.804
+0.381
0.46%
jan 1, 2003
83.185
+0.381
0.46%
jan 1, 2004
83.493
+0.309
0.37%
jan 1, 2005
83.802
+0.309
0.37%
jan 1, 2006
84.111
+0.309
0.37%
jan 1, 2007
84.42
+0.309
0.37%
jan 1, 2008
84.729
+0.309
0.37%
jan 1, 2009
84.975
+0.246
0.29%
jan 1, 2010
85.222
+0.246
0.29%
jan 1, 2011
85.468
+0.246
0.29%
jan 1, 2012
85.714
+0.246
0.29%
jan 1, 2013
85.961
+0.246
0.29%
jan 1, 2014
86.218
+0.257
0.3%
jan 1, 2015
86.475
+0.257
0.3%
Ranking of countries by current statistics by years


Comments: