29
/
en
AIzaSyAYiBZKx7MnpbEhh9jyipgxe19OcubqV5w
April 1, 2024
174831
Lao PDR
LAO
true
2
1
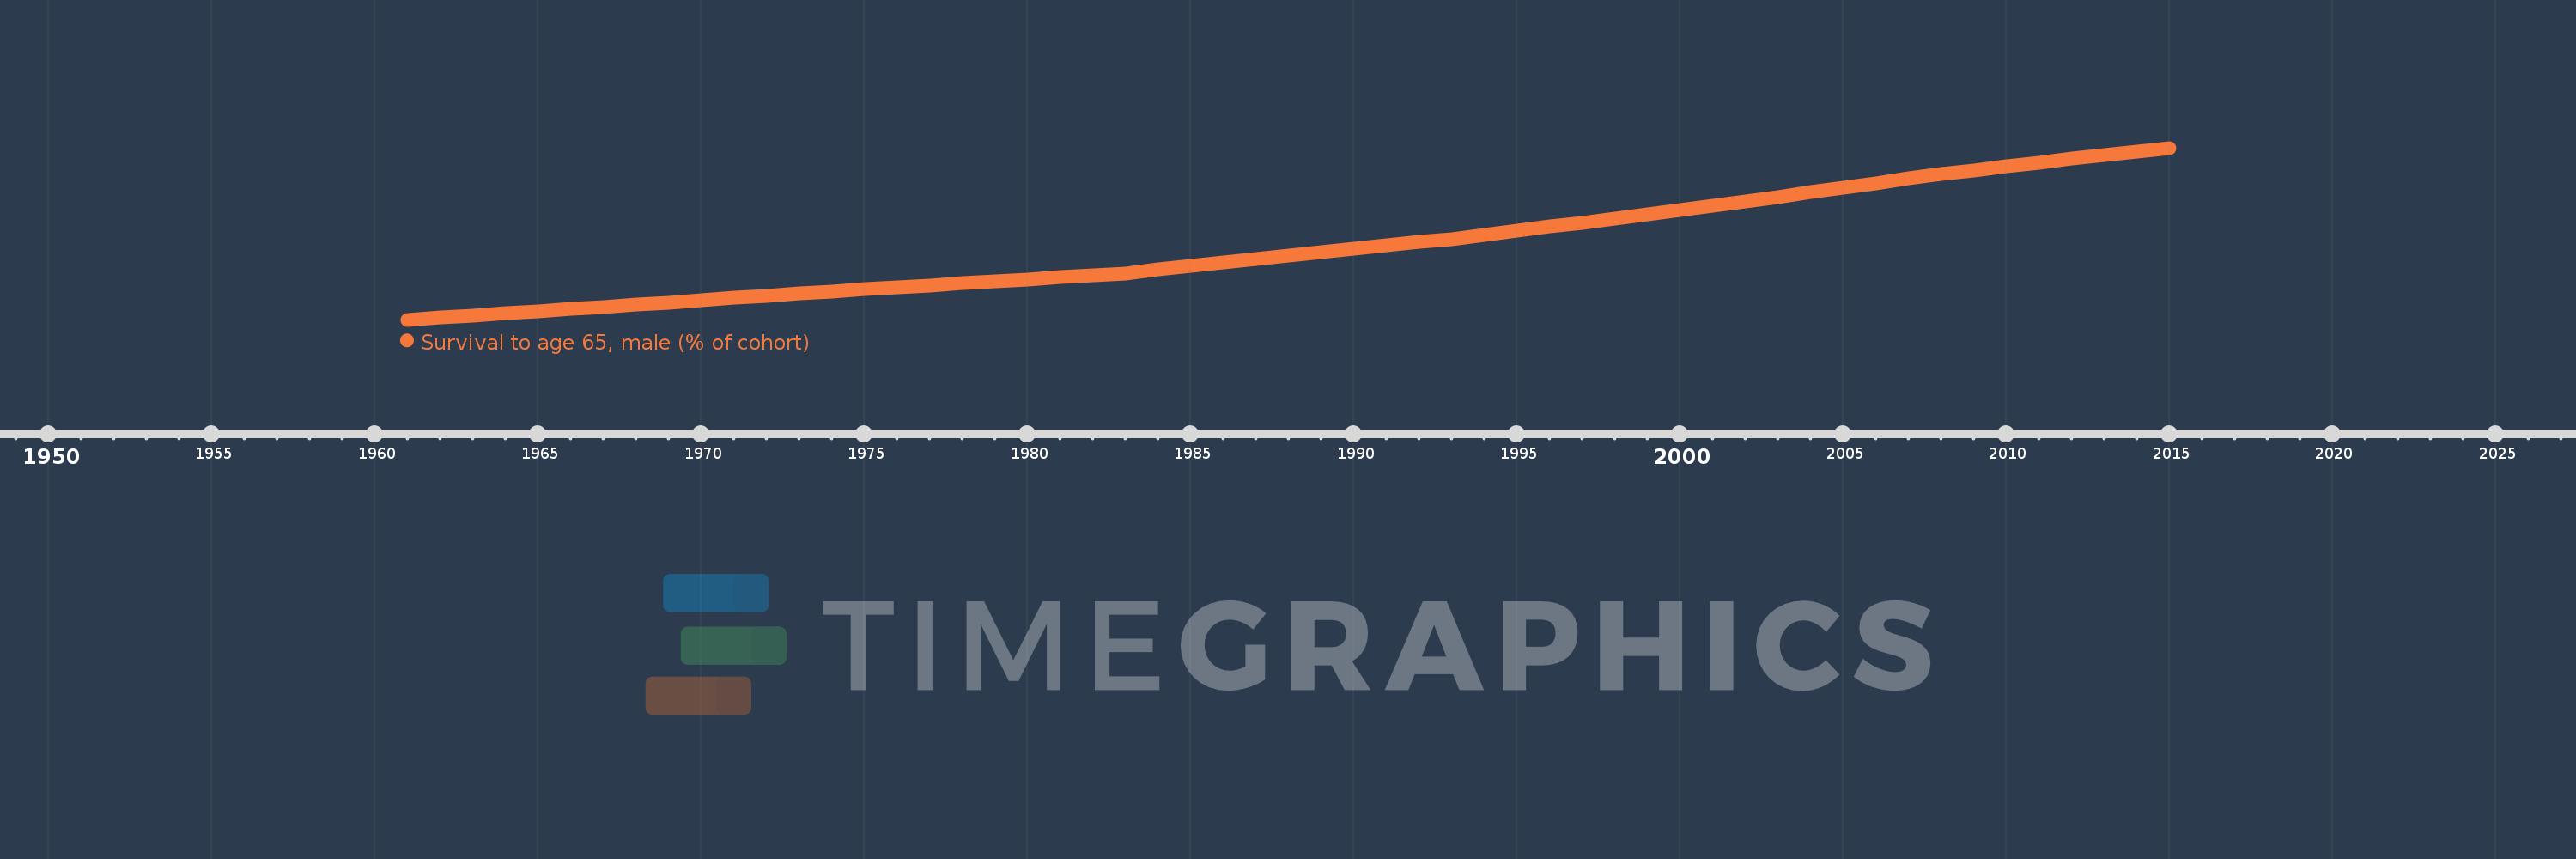
Survival to age 65, male (% of cohort)
2015,2014,2013,2012,2011,2010,2009,2008,2007,2006,2005,2004,2003,2002,2001,2000,1999,1998,1997,1996,1995,1994,1993,1992,1991,1990,1989,1988,1987,1986,1985,1984,1983,1982,1981,1980,1979,1978,1977,1976,1975,1974,1973,1972,1971,1970,1969,1968,1967,1966,1965,1964,1963,1962,1961
This statistics in other country:
AfghanistanAlbaniaAlgeriaAngolaAntigua and BarbudaArab WorldArgentinaArmeniaArubaAustraliaAustriaAzerbaijanBahamas, TheBahrainBangladeshBarbadosBelarusBelgiumBelizeBeninBhutanBoliviaBosnia and HerzegovinaBotswanaBrazilBrunei DarussalamBulgariaBurkina FasoBurundiCabo VerdeCambodiaCameroonCanadaCaribbean small statesCentral African RepublicCentral Europe and the BalticsChadChannel IslandsChileChinaColombiaComorosCongo, Dem. Rep.Congo, Rep.Costa RicaCote d'IvoireCroatiaCubaCuracaoCyprusCzech RepublicDenmarkDjiboutiDominican RepublicEarly-demographic dividendEast Asia & PacificEast Asia & Pacific (excluding high income)East Asia & Pacific (IDA & IBRD countries)EcuadorEgypt, Arab Rep.El SalvadorEquatorial GuineaEritreaEstoniaEthiopiaEuro areaEurope & Central AsiaEurope & Central Asia (excluding high income)Europe & Central Asia (IDA & IBRD countries)European UnionFijiFinlandFragile and conflict affected situationsFranceFrench PolynesiaGabonGambia, TheGeorgiaGermanyGhanaGreeceGrenadaGuamGuatemalaGuineaGuinea-BissauGuyanaHaitiHeavily indebted poor countries (HIPC)High incomeHondurasHong Kong SAR, ChinaHungaryIBRD onlyIcelandIDA & IBRD totalIDA blendIDA onlyIDA totalIndiaIndonesiaIran, Islamic Rep.IraqIrelandIsraelItalyJamaicaJapanJordanKazakhstanKenyaKiribatiKorea, Dem. People’s Rep.Korea, Rep.KuwaitKyrgyz RepublicLao PDRLate-demographic dividendLatin America & Caribbean Latin America & Caribbean (excluding high income)Latin America & the Caribbean (IDA & IBRD countries)LatviaLeast developed countries: UN classificationLebanonLesothoLiberiaLibyaLithuaniaLow & middle incomeLow incomeLower middle incomeLuxembourgMacao SAR, ChinaMacedonia, FYRMadagascarMalawiMalaysiaMaldivesMaliMaltaMauritaniaMauritiusMexicoMicronesia, Fed. Sts.Middle East & North AfricaMiddle East & North Africa (excluding high income)Middle East & North Africa (IDA & IBRD countries)Middle incomeMoldovaMongoliaMontenegroMoroccoMozambiqueMyanmarNamibiaNepalNetherlandsNew CaledoniaNew ZealandNicaraguaNigerNigeriaNorth AmericaNorwayOECD membersOmanOther small statesPacific island small statesPakistanPanamaPapua New GuineaParaguayPeruPhilippinesPolandPortugalPost-demographic dividendPre-demographic dividendPuerto RicoQatarRomaniaRussian FederationRwandaSamoaSao Tome and PrincipeSaudi ArabiaSenegalSerbiaSeychellesSierra LeoneSingaporeSlovak RepublicSloveniaSmall statesSolomon IslandsSomaliaSouth AfricaSouth AsiaSouth Asia (IDA & IBRD)South SudanSpainSri LankaSt. LuciaSt. Vincent and the GrenadinesSub-Saharan Africa Sub-Saharan Africa (excluding high income)Sub-Saharan Africa (IDA & IBRD countries)SudanSurinameSwazilandSwedenSwitzerlandSyrian Arab RepublicTajikistanTanzaniaThailandTimor-LesteTogoTongaTrinidad and TobagoTunisiaTurkeyTurkmenistanUgandaUkraineUnited Arab EmiratesUnited KingdomUnited StatesUpper middle incomeUruguayUzbekistanVanuatuVenezuela, RBVietnamVirgin Islands (U.S.)West Bank and GazaWorldYemen, Rep.ZambiaZimbabwe Timeline:
This timeline shows a graph from 1961 to 2015 of Lao PDR. No data until 1960. Number of actual observations by date: 55.
Source name:
World Development Indicators
Source organization:
United Nations Population Division. World Population Prospects. New York, United Nations, Department of Economic and Social Affairs (advanced Excel tables). Available at http://esa.un.org/wpp/unpp/panel_population.htm.
Categories, topics:
Health, Gender
Last updated:
apr 23, 2017
Indicators value changes by year
Minimum:
29.636
jan 1, 1961
Maximum:
64.483
jan 1, 2015
At the date of observation
Value
Absolute change
Change from previous value
jan 1, 1961
29.636
+29.636
0.0%
jan 1, 1962
30.066
+0.43
1.45%
jan 1, 1963
30.497
+0.43
1.43%
jan 1, 1964
30.936
+0.439
1.44%
jan 1, 1965
31.376
+0.439
1.42%
jan 1, 1966
31.815
+0.439
1.4%
jan 1, 1967
32.254
+0.439
1.38%
jan 1, 1968
32.694
+0.439
1.36%
jan 1, 1969
33.144
+0.451
1.38%
jan 1, 1970
33.595
+0.451
1.36%
jan 1, 1971
34.045
+0.451
1.34%
jan 1, 1972
34.496
+0.451
1.32%
jan 1, 1973
34.947
+0.451
1.31%
jan 1, 1974
35.358
+0.412
1.18%
jan 1, 1975
35.77
+0.412
1.16%
jan 1, 1976
36.182
+0.412
1.15%
jan 1, 1977
36.594
+0.412
1.14%
jan 1, 1978
37.006
+0.412
1.13%
jan 1, 1979
37.417
+0.411
1.11%
jan 1, 1980
37.829
+0.411
1.1%
jan 1, 1981
38.24
+0.411
1.09%
jan 1, 1982
38.651
+0.411
1.08%
jan 1, 1983
39.063
+0.411
1.06%
jan 1, 1984
39.783
+0.721
1.84%
jan 1, 1985
40.504
+0.721
1.81%
jan 1, 1986
41.224
+0.721
1.78%
jan 1, 1987
41.945
+0.721
1.75%
jan 1, 1988
42.665
+0.721
1.72%
jan 1, 1989
43.339
+0.674
1.58%
jan 1, 1990
44.013
+0.674
1.55%
jan 1, 1991
44.687
+0.674
1.53%
jan 1, 1992
45.361
+0.674
1.51%
jan 1, 1993
46.035
+0.674
1.49%
jan 1, 1994
46.853
+0.818
1.78%
jan 1, 1995
47.671
+0.818
1.75%
jan 1, 1996
48.49
+0.818
1.72%
jan 1, 1997
49.308
+0.818
1.69%
jan 1, 1998
50.126
+0.818
1.66%
jan 1, 1999
51.016
+0.89
1.78%
jan 1, 2000
51.907
+0.89
1.74%
jan 1, 2001
52.797
+0.89
1.71%
jan 1, 2002
53.687
+0.89
1.69%
jan 1, 2003
54.577
+0.89
1.66%
jan 1, 2004
55.496
+0.919
1.68%
jan 1, 2005
56.415
+0.919
1.66%
jan 1, 2006
57.334
+0.919
1.63%
jan 1, 2007
58.253
+0.919
1.6%
jan 1, 2008
59.172
+0.919
1.58%
jan 1, 2009
59.958
+0.786
1.33%
jan 1, 2010
60.744
+0.786
1.31%
jan 1, 2011
61.53
+0.786
1.29%
jan 1, 2012
62.316
+0.786
1.28%
jan 1, 2013
63.102
+0.786
1.26%
jan 1, 2014
63.793
+0.69
1.09%
jan 1, 2015
64.483
+0.69
1.08%
Ranking of countries by current statistics by years


Comments: