29
/
en
AIzaSyAYiBZKx7MnpbEhh9jyipgxe19OcubqV5w
April 1, 2024
161029
Israel
ISR
true
2
1
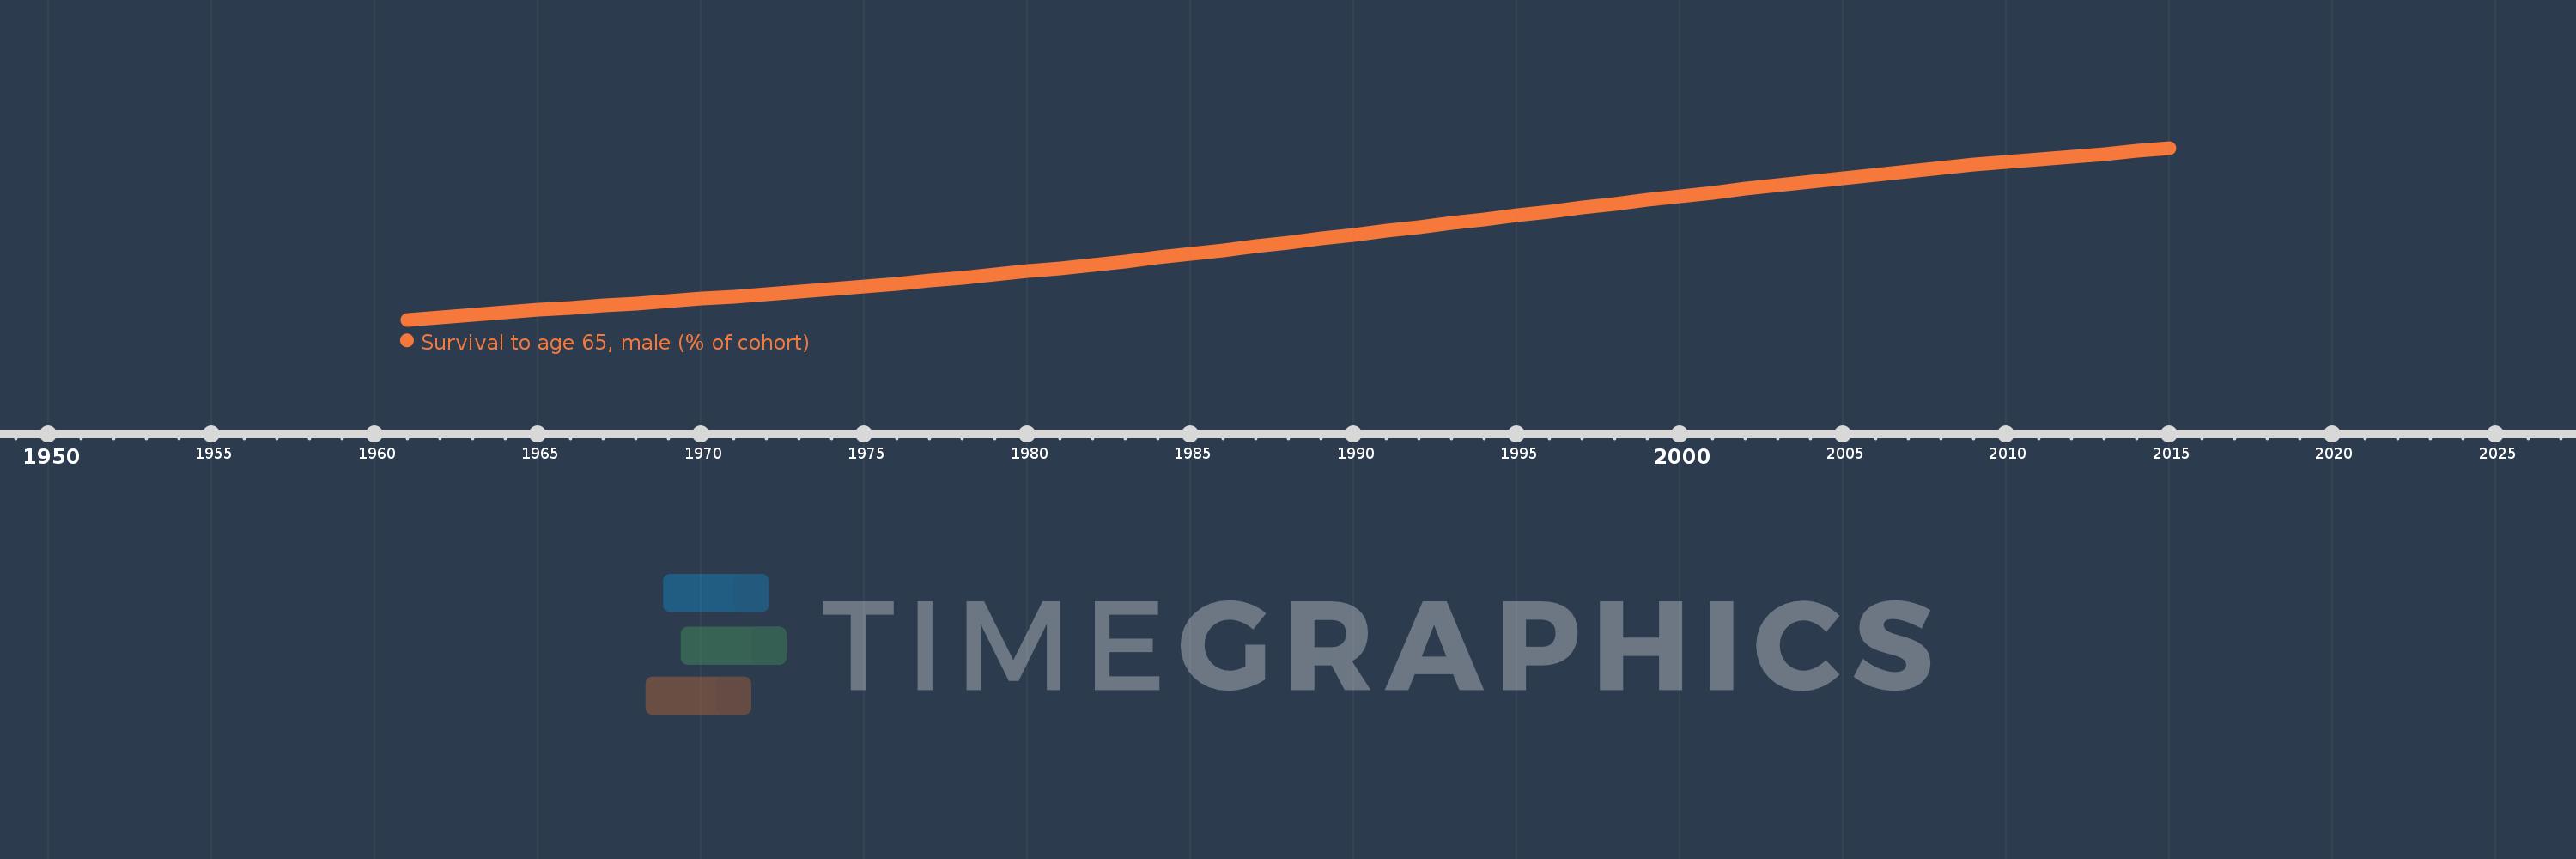
Survival to age 65, male (% of cohort)
2015,2014,2013,2012,2011,2010,2009,2008,2007,2006,2005,2004,2003,2002,2001,2000,1999,1998,1997,1996,1995,1994,1993,1992,1991,1990,1989,1988,1987,1986,1985,1984,1983,1982,1981,1980,1979,1978,1977,1976,1975,1974,1973,1972,1971,1970,1969,1968,1967,1966,1965,1964,1963,1962,1961
This statistics in other country:
AfghanistanAlbaniaAlgeriaAngolaAntigua and BarbudaArab WorldArgentinaArmeniaArubaAustraliaAustriaAzerbaijanBahamas, TheBahrainBangladeshBarbadosBelarusBelgiumBelizeBeninBhutanBoliviaBosnia and HerzegovinaBotswanaBrazilBrunei DarussalamBulgariaBurkina FasoBurundiCabo VerdeCambodiaCameroonCanadaCaribbean small statesCentral African RepublicCentral Europe and the BalticsChadChannel IslandsChileChinaColombiaComorosCongo, Dem. Rep.Congo, Rep.Costa RicaCote d'IvoireCroatiaCubaCuracaoCyprusCzech RepublicDenmarkDjiboutiDominican RepublicEarly-demographic dividendEast Asia & PacificEast Asia & Pacific (excluding high income)East Asia & Pacific (IDA & IBRD countries)EcuadorEgypt, Arab Rep.El SalvadorEquatorial GuineaEritreaEstoniaEthiopiaEuro areaEurope & Central AsiaEurope & Central Asia (excluding high income)Europe & Central Asia (IDA & IBRD countries)European UnionFijiFinlandFragile and conflict affected situationsFranceFrench PolynesiaGabonGambia, TheGeorgiaGermanyGhanaGreeceGrenadaGuamGuatemalaGuineaGuinea-BissauGuyanaHaitiHeavily indebted poor countries (HIPC)High incomeHondurasHong Kong SAR, ChinaHungaryIBRD onlyIcelandIDA & IBRD totalIDA blendIDA onlyIDA totalIndiaIndonesiaIran, Islamic Rep.IraqIrelandIsraelItalyJamaicaJapanJordanKazakhstanKenyaKiribatiKorea, Dem. People’s Rep.Korea, Rep.KuwaitKyrgyz RepublicLao PDRLate-demographic dividendLatin America & Caribbean Latin America & Caribbean (excluding high income)Latin America & the Caribbean (IDA & IBRD countries)LatviaLeast developed countries: UN classificationLebanonLesothoLiberiaLibyaLithuaniaLow & middle incomeLow incomeLower middle incomeLuxembourgMacao SAR, ChinaMacedonia, FYRMadagascarMalawiMalaysiaMaldivesMaliMaltaMauritaniaMauritiusMexicoMicronesia, Fed. Sts.Middle East & North AfricaMiddle East & North Africa (excluding high income)Middle East & North Africa (IDA & IBRD countries)Middle incomeMoldovaMongoliaMontenegroMoroccoMozambiqueMyanmarNamibiaNepalNetherlandsNew CaledoniaNew ZealandNicaraguaNigerNigeriaNorth AmericaNorwayOECD membersOmanOther small statesPacific island small statesPakistanPanamaPapua New GuineaParaguayPeruPhilippinesPolandPortugalPost-demographic dividendPre-demographic dividendPuerto RicoQatarRomaniaRussian FederationRwandaSamoaSao Tome and PrincipeSaudi ArabiaSenegalSerbiaSeychellesSierra LeoneSingaporeSlovak RepublicSloveniaSmall statesSolomon IslandsSomaliaSouth AfricaSouth AsiaSouth Asia (IDA & IBRD)South SudanSpainSri LankaSt. LuciaSt. Vincent and the GrenadinesSub-Saharan Africa Sub-Saharan Africa (excluding high income)Sub-Saharan Africa (IDA & IBRD countries)SudanSurinameSwazilandSwedenSwitzerlandSyrian Arab RepublicTajikistanTanzaniaThailandTimor-LesteTogoTongaTrinidad and TobagoTunisiaTurkeyTurkmenistanUgandaUkraineUnited Arab EmiratesUnited KingdomUnited StatesUpper middle incomeUruguayUzbekistanVanuatuVenezuela, RBVietnamVirgin Islands (U.S.)West Bank and GazaWorldYemen, Rep.ZambiaZimbabwe Timeline:
This timeline shows a graph from 1961 to 2015 of Israel. No data until 1960. Number of actual observations by date: 55.
Source name:
World Development Indicators
Source organization:
United Nations Population Division. World Population Prospects. New York, United Nations, Department of Economic and Social Affairs (advanced Excel tables). Available at http://esa.un.org/wpp/unpp/panel_population.htm.
Categories, topics:
Health, Gender
Last updated:
apr 23, 2017
Indicators value changes by year
Minimum:
72.438
jan 1, 1961
Maximum:
88.379
jan 1, 2015
At the date of observation
Value
Absolute change
Change from previous value
jan 1, 1961
72.438
+72.438
0.0%
jan 1, 1962
72.684
+0.246
0.34%
jan 1, 1963
72.93
+0.246
0.34%
jan 1, 1964
73.135
+0.205
0.28%
jan 1, 1965
73.34
+0.205
0.28%
jan 1, 1966
73.545
+0.205
0.28%
jan 1, 1967
73.75
+0.205
0.28%
jan 1, 1968
73.955
+0.205
0.28%
jan 1, 1969
74.166
+0.211
0.29%
jan 1, 1970
74.377
+0.211
0.28%
jan 1, 1971
74.589
+0.211
0.28%
jan 1, 1972
74.8
+0.211
0.28%
jan 1, 1973
75.011
+0.211
0.28%
jan 1, 1974
75.269
+0.258
0.34%
jan 1, 1975
75.527
+0.258
0.34%
jan 1, 1976
75.785
+0.258
0.34%
jan 1, 1977
76.042
+0.258
0.34%
jan 1, 1978
76.3
+0.258
0.34%
jan 1, 1979
76.61
+0.31
0.41%
jan 1, 1980
76.92
+0.31
0.4%
jan 1, 1981
77.23
+0.31
0.4%
jan 1, 1982
77.54
+0.31
0.4%
jan 1, 1983
77.851
+0.31
0.4%
jan 1, 1984
78.197
+0.347
0.45%
jan 1, 1985
78.544
+0.347
0.44%
jan 1, 1986
78.891
+0.347
0.44%
jan 1, 1987
79.237
+0.347
0.44%
jan 1, 1988
79.584
+0.347
0.44%
jan 1, 1989
79.948
+0.364
0.46%
jan 1, 1990
80.312
+0.364
0.46%
jan 1, 1991
80.676
+0.364
0.45%
jan 1, 1992
81.039
+0.364
0.45%
jan 1, 1993
81.403
+0.364
0.45%
jan 1, 1994
81.764
+0.361
0.44%
jan 1, 1995
82.125
+0.361
0.44%
jan 1, 1996
82.485
+0.361
0.44%
jan 1, 1997
82.846
+0.361
0.44%
jan 1, 1998
83.207
+0.361
0.44%
jan 1, 1999
83.553
+0.347
0.42%
jan 1, 2000
83.9
+0.347
0.42%
jan 1, 2001
84.247
+0.347
0.41%
jan 1, 2002
84.594
+0.347
0.41%
jan 1, 2003
84.941
+0.347
0.41%
jan 1, 2004
85.264
+0.323
0.38%
jan 1, 2005
85.587
+0.323
0.38%
jan 1, 2006
85.91
+0.323
0.38%
jan 1, 2007
86.233
+0.323
0.38%
jan 1, 2008
86.556
+0.323
0.37%
jan 1, 2009
86.812
+0.256
0.3%
jan 1, 2010
87.068
+0.256
0.3%
jan 1, 2011
87.325
+0.256
0.29%
jan 1, 2012
87.581
+0.256
0.29%
jan 1, 2013
87.837
+0.256
0.29%
jan 1, 2014
88.108
+0.271
0.31%
jan 1, 2015
88.379
+0.271
0.31%
Ranking of countries by current statistics by years


Comments: