29
/
en
AIzaSyAYiBZKx7MnpbEhh9jyipgxe19OcubqV5w
April 1, 2024
164291
Japan
JPN
true
2
1
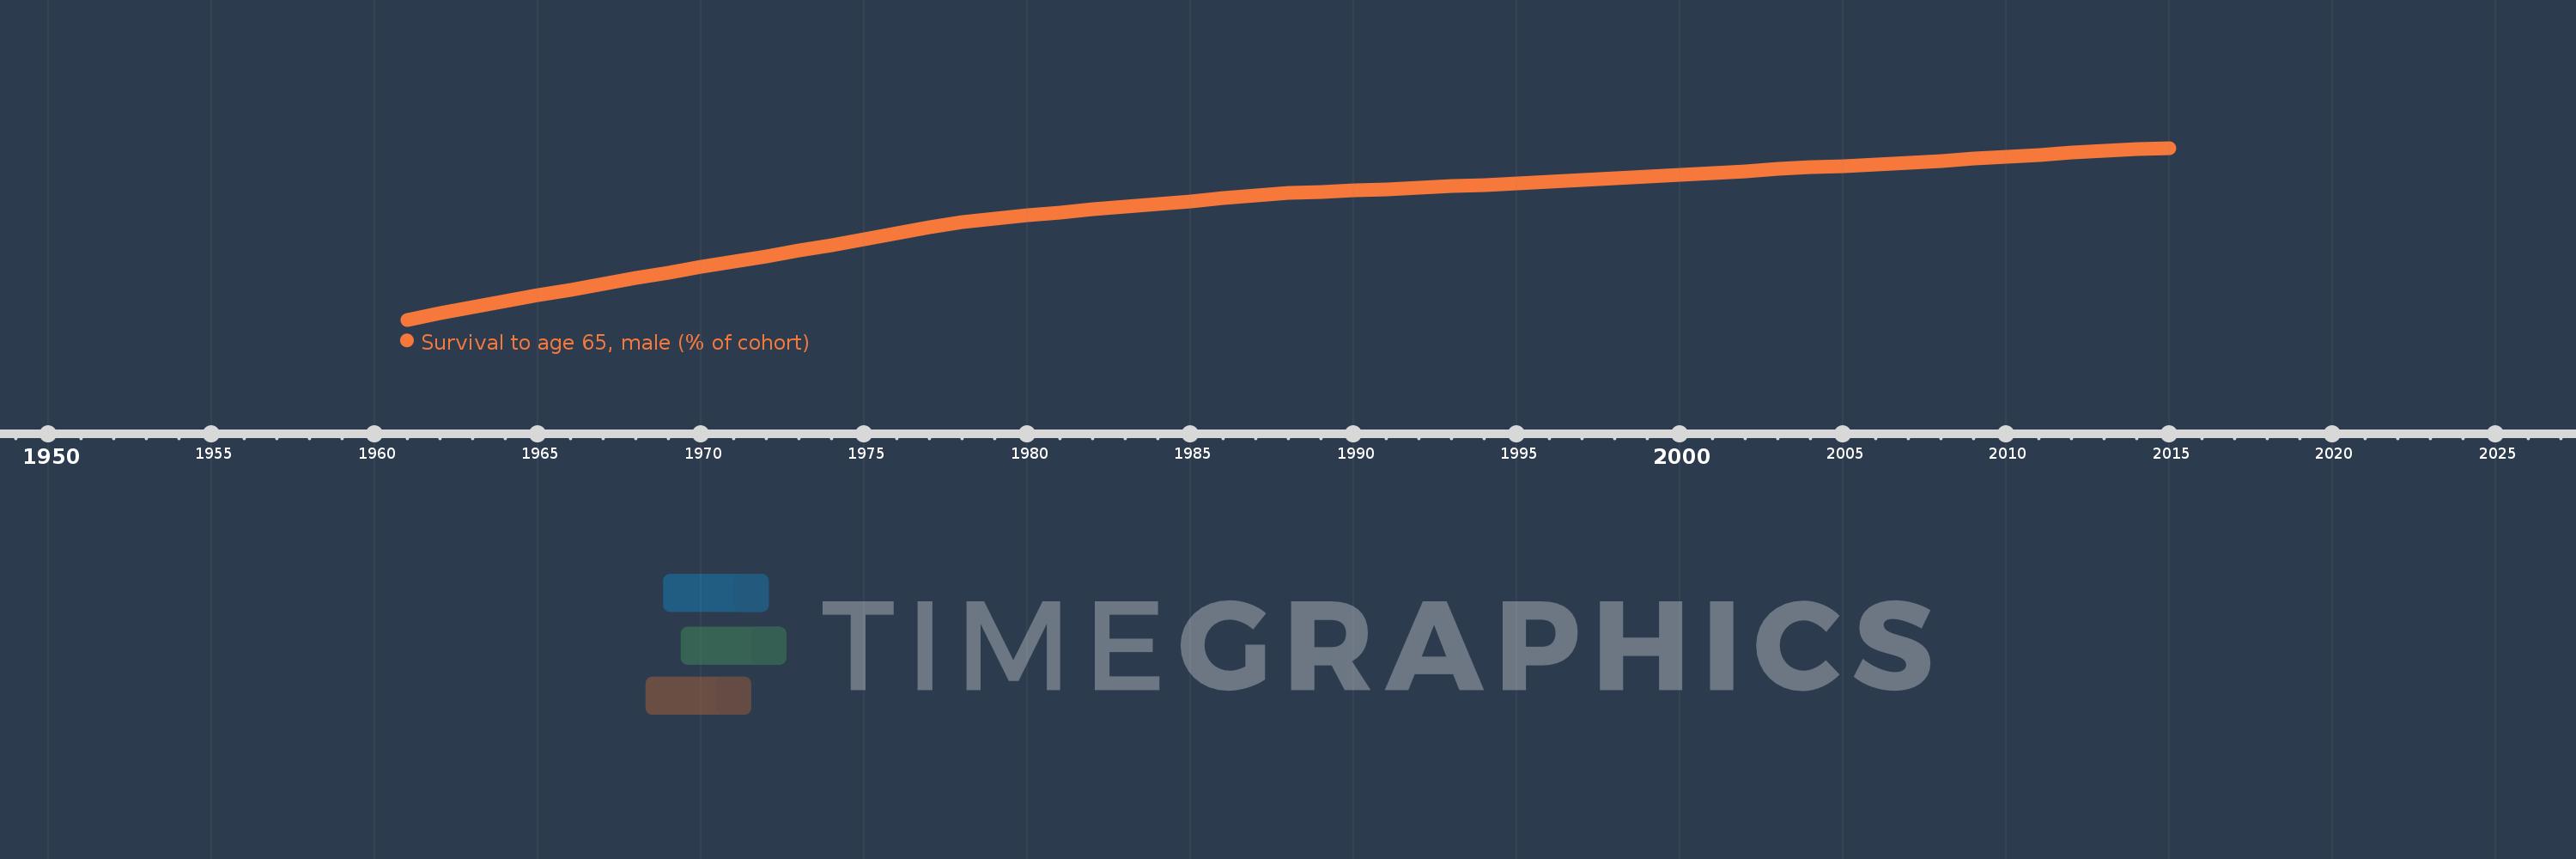
Survival to age 65, male (% of cohort)
2015,2014,2013,2012,2011,2010,2009,2008,2007,2006,2005,2004,2003,2002,2001,2000,1999,1998,1997,1996,1995,1994,1993,1992,1991,1990,1989,1988,1987,1986,1985,1984,1983,1982,1981,1980,1979,1978,1977,1976,1975,1974,1973,1972,1971,1970,1969,1968,1967,1966,1965,1964,1963,1962,1961
This statistics in other country:
AfghanistanAlbaniaAlgeriaAngolaAntigua and BarbudaArab WorldArgentinaArmeniaArubaAustraliaAustriaAzerbaijanBahamas, TheBahrainBangladeshBarbadosBelarusBelgiumBelizeBeninBhutanBoliviaBosnia and HerzegovinaBotswanaBrazilBrunei DarussalamBulgariaBurkina FasoBurundiCabo VerdeCambodiaCameroonCanadaCaribbean small statesCentral African RepublicCentral Europe and the BalticsChadChannel IslandsChileChinaColombiaComorosCongo, Dem. Rep.Congo, Rep.Costa RicaCote d'IvoireCroatiaCubaCuracaoCyprusCzech RepublicDenmarkDjiboutiDominican RepublicEarly-demographic dividendEast Asia & PacificEast Asia & Pacific (excluding high income)East Asia & Pacific (IDA & IBRD countries)EcuadorEgypt, Arab Rep.El SalvadorEquatorial GuineaEritreaEstoniaEthiopiaEuro areaEurope & Central AsiaEurope & Central Asia (excluding high income)Europe & Central Asia (IDA & IBRD countries)European UnionFijiFinlandFragile and conflict affected situationsFranceFrench PolynesiaGabonGambia, TheGeorgiaGermanyGhanaGreeceGrenadaGuamGuatemalaGuineaGuinea-BissauGuyanaHaitiHeavily indebted poor countries (HIPC)High incomeHondurasHong Kong SAR, ChinaHungaryIBRD onlyIcelandIDA & IBRD totalIDA blendIDA onlyIDA totalIndiaIndonesiaIran, Islamic Rep.IraqIrelandIsraelItalyJamaicaJapanJordanKazakhstanKenyaKiribatiKorea, Dem. People’s Rep.Korea, Rep.KuwaitKyrgyz RepublicLao PDRLate-demographic dividendLatin America & Caribbean Latin America & Caribbean (excluding high income)Latin America & the Caribbean (IDA & IBRD countries)LatviaLeast developed countries: UN classificationLebanonLesothoLiberiaLibyaLithuaniaLow & middle incomeLow incomeLower middle incomeLuxembourgMacao SAR, ChinaMacedonia, FYRMadagascarMalawiMalaysiaMaldivesMaliMaltaMauritaniaMauritiusMexicoMicronesia, Fed. Sts.Middle East & North AfricaMiddle East & North Africa (excluding high income)Middle East & North Africa (IDA & IBRD countries)Middle incomeMoldovaMongoliaMontenegroMoroccoMozambiqueMyanmarNamibiaNepalNetherlandsNew CaledoniaNew ZealandNicaraguaNigerNigeriaNorth AmericaNorwayOECD membersOmanOther small statesPacific island small statesPakistanPanamaPapua New GuineaParaguayPeruPhilippinesPolandPortugalPost-demographic dividendPre-demographic dividendPuerto RicoQatarRomaniaRussian FederationRwandaSamoaSao Tome and PrincipeSaudi ArabiaSenegalSerbiaSeychellesSierra LeoneSingaporeSlovak RepublicSloveniaSmall statesSolomon IslandsSomaliaSouth AfricaSouth AsiaSouth Asia (IDA & IBRD)South SudanSpainSri LankaSt. LuciaSt. Vincent and the GrenadinesSub-Saharan Africa Sub-Saharan Africa (excluding high income)Sub-Saharan Africa (IDA & IBRD countries)SudanSurinameSwazilandSwedenSwitzerlandSyrian Arab RepublicTajikistanTanzaniaThailandTimor-LesteTogoTongaTrinidad and TobagoTunisiaTurkeyTurkmenistanUgandaUkraineUnited Arab EmiratesUnited KingdomUnited StatesUpper middle incomeUruguayUzbekistanVanuatuVenezuela, RBVietnamVirgin Islands (U.S.)West Bank and GazaWorldYemen, Rep.ZambiaZimbabwe Timeline:
This timeline shows a graph from 1961 to 2015 of Japan. No data until 1960. Number of actual observations by date: 55.
Source name:
World Development Indicators
Source organization:
United Nations Population Division. World Population Prospects. New York, United Nations, Department of Economic and Social Affairs (advanced Excel tables). Available at http://esa.un.org/wpp/unpp/panel_population.htm.
Categories, topics:
Health, Gender
Last updated:
apr 23, 2017
Indicators value changes by year
Minimum:
65.199
jan 1, 1961
Maximum:
88.042
jan 1, 2015
At the date of observation
Value
Absolute change
Change from previous value
jan 1, 1961
65.199
+65.199
0.0%
jan 1, 1962
66.04
+0.841
1.29%
jan 1, 1963
66.881
+0.841
1.27%
jan 1, 1964
67.657
+0.776
1.16%
jan 1, 1965
68.433
+0.776
1.15%
jan 1, 1966
69.209
+0.776
1.13%
jan 1, 1967
69.985
+0.776
1.12%
jan 1, 1968
70.76
+0.776
1.11%
jan 1, 1969
71.486
+0.725
1.02%
jan 1, 1970
72.211
+0.725
1.01%
jan 1, 1971
72.936
+0.725
1.0%
jan 1, 1972
73.661
+0.725
0.99%
jan 1, 1973
74.386
+0.725
0.98%
jan 1, 1974
75.154
+0.768
1.03%
jan 1, 1975
75.922
+0.768
1.02%
jan 1, 1976
76.69
+0.768
1.01%
jan 1, 1977
77.458
+0.768
1.0%
jan 1, 1978
78.226
+0.768
0.99%
jan 1, 1979
78.638
+0.412
0.53%
jan 1, 1980
79.05
+0.412
0.52%
jan 1, 1981
79.462
+0.412
0.52%
jan 1, 1982
79.873
+0.412
0.52%
jan 1, 1983
80.285
+0.412
0.52%
jan 1, 1984
80.633
+0.348
0.43%
jan 1, 1985
80.981
+0.348
0.43%
jan 1, 1986
81.329
+0.348
0.43%
jan 1, 1987
81.676
+0.348
0.43%
jan 1, 1988
82.024
+0.348
0.43%
jan 1, 1989
82.205
+0.181
0.22%
jan 1, 1990
82.386
+0.181
0.22%
jan 1, 1991
82.567
+0.181
0.22%
jan 1, 1992
82.748
+0.181
0.22%
jan 1, 1993
82.929
+0.181
0.22%
jan 1, 1994
83.138
+0.209
0.25%
jan 1, 1995
83.347
+0.209
0.25%
jan 1, 1996
83.557
+0.209
0.25%
jan 1, 1997
83.766
+0.209
0.25%
jan 1, 1998
83.976
+0.209
0.25%
jan 1, 1999
84.227
+0.251
0.3%
jan 1, 2000
84.478
+0.251
0.3%
jan 1, 2001
84.73
+0.251
0.3%
jan 1, 2002
84.981
+0.251
0.3%
jan 1, 2003
85.232
+0.251
0.3%
jan 1, 2004
85.449
+0.217
0.25%
jan 1, 2005
85.666
+0.217
0.25%
jan 1, 2006
85.882
+0.217
0.25%
jan 1, 2007
86.099
+0.217
0.25%
jan 1, 2008
86.315
+0.217
0.25%
jan 1, 2009
86.588
+0.273
0.32%
jan 1, 2010
86.861
+0.273
0.31%
jan 1, 2011
87.134
+0.273
0.31%
jan 1, 2012
87.406
+0.273
0.31%
jan 1, 2013
87.679
+0.273
0.31%
jan 1, 2014
87.861
+0.182
0.21%
jan 1, 2015
88.042
+0.181
0.21%
Ranking of countries by current statistics by years


Comments: