29
/
en
AIzaSyAYiBZKx7MnpbEhh9jyipgxe19OcubqV5w
April 1, 2024
68434
Angola
AGO
true
2
1
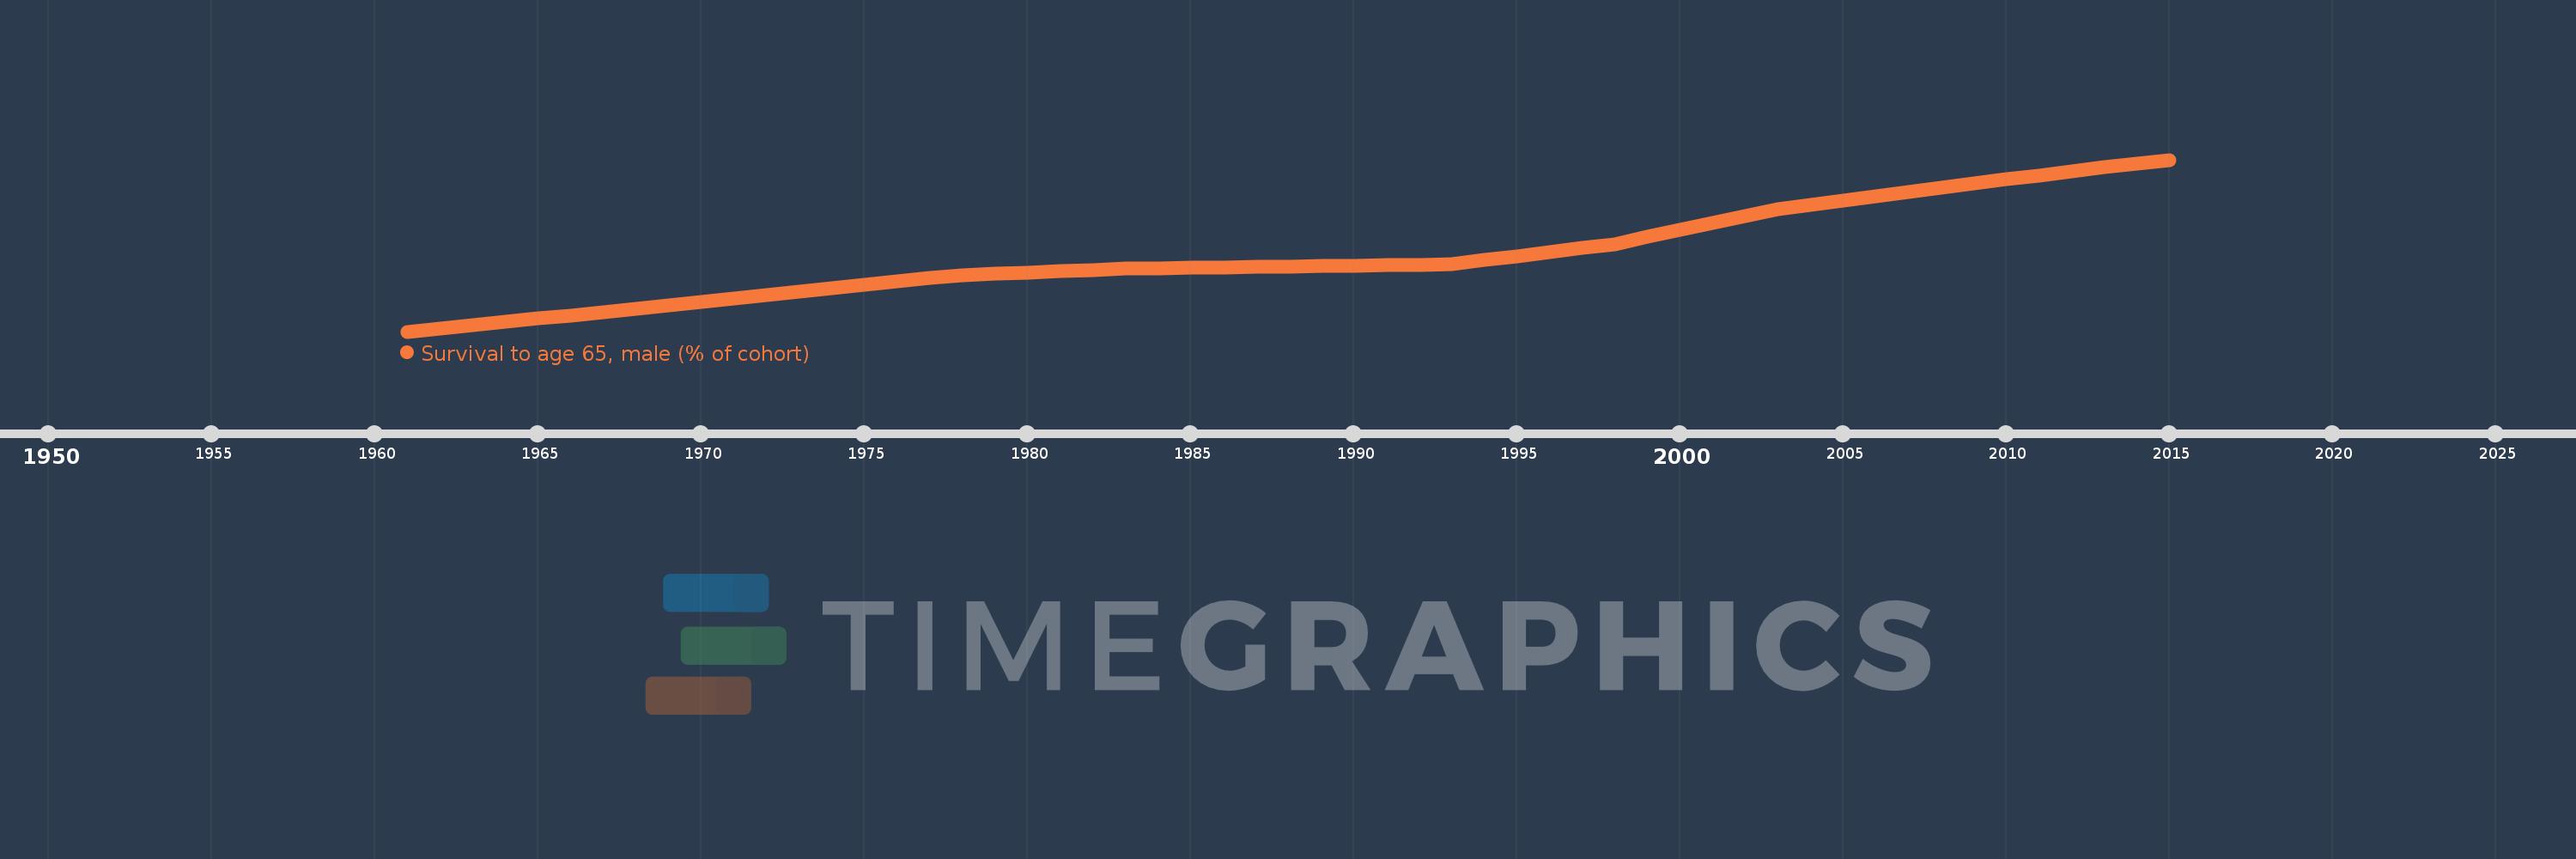
Survival to age 65, male (% of cohort)
2015,2014,2013,2012,2011,2010,2009,2008,2007,2006,2005,2004,2003,2002,2001,2000,1999,1998,1997,1996,1995,1994,1993,1992,1991,1990,1989,1988,1987,1986,1985,1984,1983,1982,1981,1980,1979,1978,1977,1976,1975,1974,1973,1972,1971,1970,1969,1968,1967,1966,1965,1964,1963,1962,1961
This statistics in other country:
AfghanistanAlbaniaAlgeriaAngolaAntigua and BarbudaArab WorldArgentinaArmeniaArubaAustraliaAustriaAzerbaijanBahamas, TheBahrainBangladeshBarbadosBelarusBelgiumBelizeBeninBhutanBoliviaBosnia and HerzegovinaBotswanaBrazilBrunei DarussalamBulgariaBurkina FasoBurundiCabo VerdeCambodiaCameroonCanadaCaribbean small statesCentral African RepublicCentral Europe and the BalticsChadChannel IslandsChileChinaColombiaComorosCongo, Dem. Rep.Congo, Rep.Costa RicaCote d'IvoireCroatiaCubaCuracaoCyprusCzech RepublicDenmarkDjiboutiDominican RepublicEarly-demographic dividendEast Asia & PacificEast Asia & Pacific (excluding high income)East Asia & Pacific (IDA & IBRD countries)EcuadorEgypt, Arab Rep.El SalvadorEquatorial GuineaEritreaEstoniaEthiopiaEuro areaEurope & Central AsiaEurope & Central Asia (excluding high income)Europe & Central Asia (IDA & IBRD countries)European UnionFijiFinlandFragile and conflict affected situationsFranceFrench PolynesiaGabonGambia, TheGeorgiaGermanyGhanaGreeceGrenadaGuamGuatemalaGuineaGuinea-BissauGuyanaHaitiHeavily indebted poor countries (HIPC)High incomeHondurasHong Kong SAR, ChinaHungaryIBRD onlyIcelandIDA & IBRD totalIDA blendIDA onlyIDA totalIndiaIndonesiaIran, Islamic Rep.IraqIrelandIsraelItalyJamaicaJapanJordanKazakhstanKenyaKiribatiKorea, Dem. People’s Rep.Korea, Rep.KuwaitKyrgyz RepublicLao PDRLate-demographic dividendLatin America & Caribbean Latin America & Caribbean (excluding high income)Latin America & the Caribbean (IDA & IBRD countries)LatviaLeast developed countries: UN classificationLebanonLesothoLiberiaLibyaLithuaniaLow & middle incomeLow incomeLower middle incomeLuxembourgMacao SAR, ChinaMacedonia, FYRMadagascarMalawiMalaysiaMaldivesMaliMaltaMauritaniaMauritiusMexicoMicronesia, Fed. Sts.Middle East & North AfricaMiddle East & North Africa (excluding high income)Middle East & North Africa (IDA & IBRD countries)Middle incomeMoldovaMongoliaMontenegroMoroccoMozambiqueMyanmarNamibiaNepalNetherlandsNew CaledoniaNew ZealandNicaraguaNigerNigeriaNorth AmericaNorwayOECD membersOmanOther small statesPacific island small statesPakistanPanamaPapua New GuineaParaguayPeruPhilippinesPolandPortugalPost-demographic dividendPre-demographic dividendPuerto RicoQatarRomaniaRussian FederationRwandaSamoaSao Tome and PrincipeSaudi ArabiaSenegalSerbiaSeychellesSierra LeoneSingaporeSlovak RepublicSloveniaSmall statesSolomon IslandsSomaliaSouth AfricaSouth AsiaSouth Asia (IDA & IBRD)South SudanSpainSri LankaSt. LuciaSt. Vincent and the GrenadinesSub-Saharan Africa Sub-Saharan Africa (excluding high income)Sub-Saharan Africa (IDA & IBRD countries)SudanSurinameSwazilandSwedenSwitzerlandSyrian Arab RepublicTajikistanTanzaniaThailandTimor-LesteTogoTongaTrinidad and TobagoTunisiaTurkeyTurkmenistanUgandaUkraineUnited Arab EmiratesUnited KingdomUnited StatesUpper middle incomeUruguayUzbekistanVanuatuVenezuela, RBVietnamVirgin Islands (U.S.)West Bank and GazaWorldYemen, Rep.ZambiaZimbabwe Timeline:
This timeline shows a graph from 1961 to 2015 of Angola. No data until 1960. Number of actual observations by date: 55.
Source name:
World Development Indicators
Source organization:
United Nations Population Division. World Population Prospects. New York, United Nations, Department of Economic and Social Affairs (advanced Excel tables). Available at http://esa.un.org/wpp/unpp/panel_population.htm.
Categories, topics:
Health, Gender
Last updated:
apr 23, 2017
Indicators value changes by year
Minimum:
19.377
jan 1, 1961
Maximum:
43.908
jan 1, 2015
At the date of observation
Value
Absolute change
Change from previous value
jan 1, 1961
19.377
+19.377
0.0%
jan 1, 1962
19.829
+0.452
2.33%
jan 1, 1963
20.281
+0.452
2.28%
jan 1, 1964
20.754
+0.473
2.33%
jan 1, 1965
21.227
+0.473
2.28%
jan 1, 1966
21.7
+0.473
2.23%
jan 1, 1967
22.173
+0.473
2.18%
jan 1, 1968
22.646
+0.473
2.13%
jan 1, 1969
23.145
+0.499
2.2%
jan 1, 1970
23.643
+0.499
2.15%
jan 1, 1971
24.142
+0.499
2.11%
jan 1, 1972
24.641
+0.499
2.07%
jan 1, 1973
25.139
+0.499
2.02%
jan 1, 1974
25.602
+0.463
1.84%
jan 1, 1975
26.065
+0.463
1.81%
jan 1, 1976
26.527
+0.463
1.78%
jan 1, 1977
26.99
+0.463
1.74%
jan 1, 1978
27.453
+0.463
1.71%
jan 1, 1979
27.637
+0.184
0.67%
jan 1, 1980
27.822
+0.184
0.67%
jan 1, 1981
28.006
+0.184
0.66%
jan 1, 1982
28.19
+0.184
0.66%
jan 1, 1983
28.375
+0.184
0.65%
jan 1, 1984
28.435
+0.061
0.21%
jan 1, 1985
28.496
+0.061
0.21%
jan 1, 1986
28.557
+0.061
0.21%
jan 1, 1987
28.617
+0.061
0.21%
jan 1, 1988
28.678
+0.061
0.21%
jan 1, 1989
28.742
+0.063
0.22%
jan 1, 1990
28.805
+0.063
0.22%
jan 1, 1991
28.869
+0.063
0.22%
jan 1, 1992
28.932
+0.063
0.22%
jan 1, 1993
28.996
+0.063
0.22%
jan 1, 1994
29.572
+0.576
1.99%
jan 1, 1995
30.148
+0.576
1.95%
jan 1, 1996
30.724
+0.576
1.91%
jan 1, 1997
31.301
+0.576
1.88%
jan 1, 1998
31.877
+0.576
1.84%
jan 1, 1999
32.883
+1.006
3.16%
jan 1, 2000
33.888
+1.006
3.06%
jan 1, 2001
34.894
+1.006
2.97%
jan 1, 2002
35.9
+1.006
2.88%
jan 1, 2003
36.905
+1.006
2.8%
jan 1, 2004
37.519
+0.614
1.66%
jan 1, 2005
38.132
+0.614
1.64%
jan 1, 2006
38.746
+0.614
1.61%
jan 1, 2007
39.36
+0.614
1.58%
jan 1, 2008
39.973
+0.614
1.56%
jan 1, 2009
40.541
+0.568
1.42%
jan 1, 2010
41.109
+0.568
1.4%
jan 1, 2011
41.677
+0.568
1.38%
jan 1, 2012
42.245
+0.568
1.36%
jan 1, 2013
42.814
+0.568
1.34%
jan 1, 2014
43.361
+0.547
1.28%
jan 1, 2015
43.908
+0.547
1.26%
Ranking of countries by current statistics by years


Comments: