29
/
en
AIzaSyAYiBZKx7MnpbEhh9jyipgxe19OcubqV5w
April 1, 2024
29535
East Asia & Pacific (IDA & IBRD countries)
TEA
false
2
1
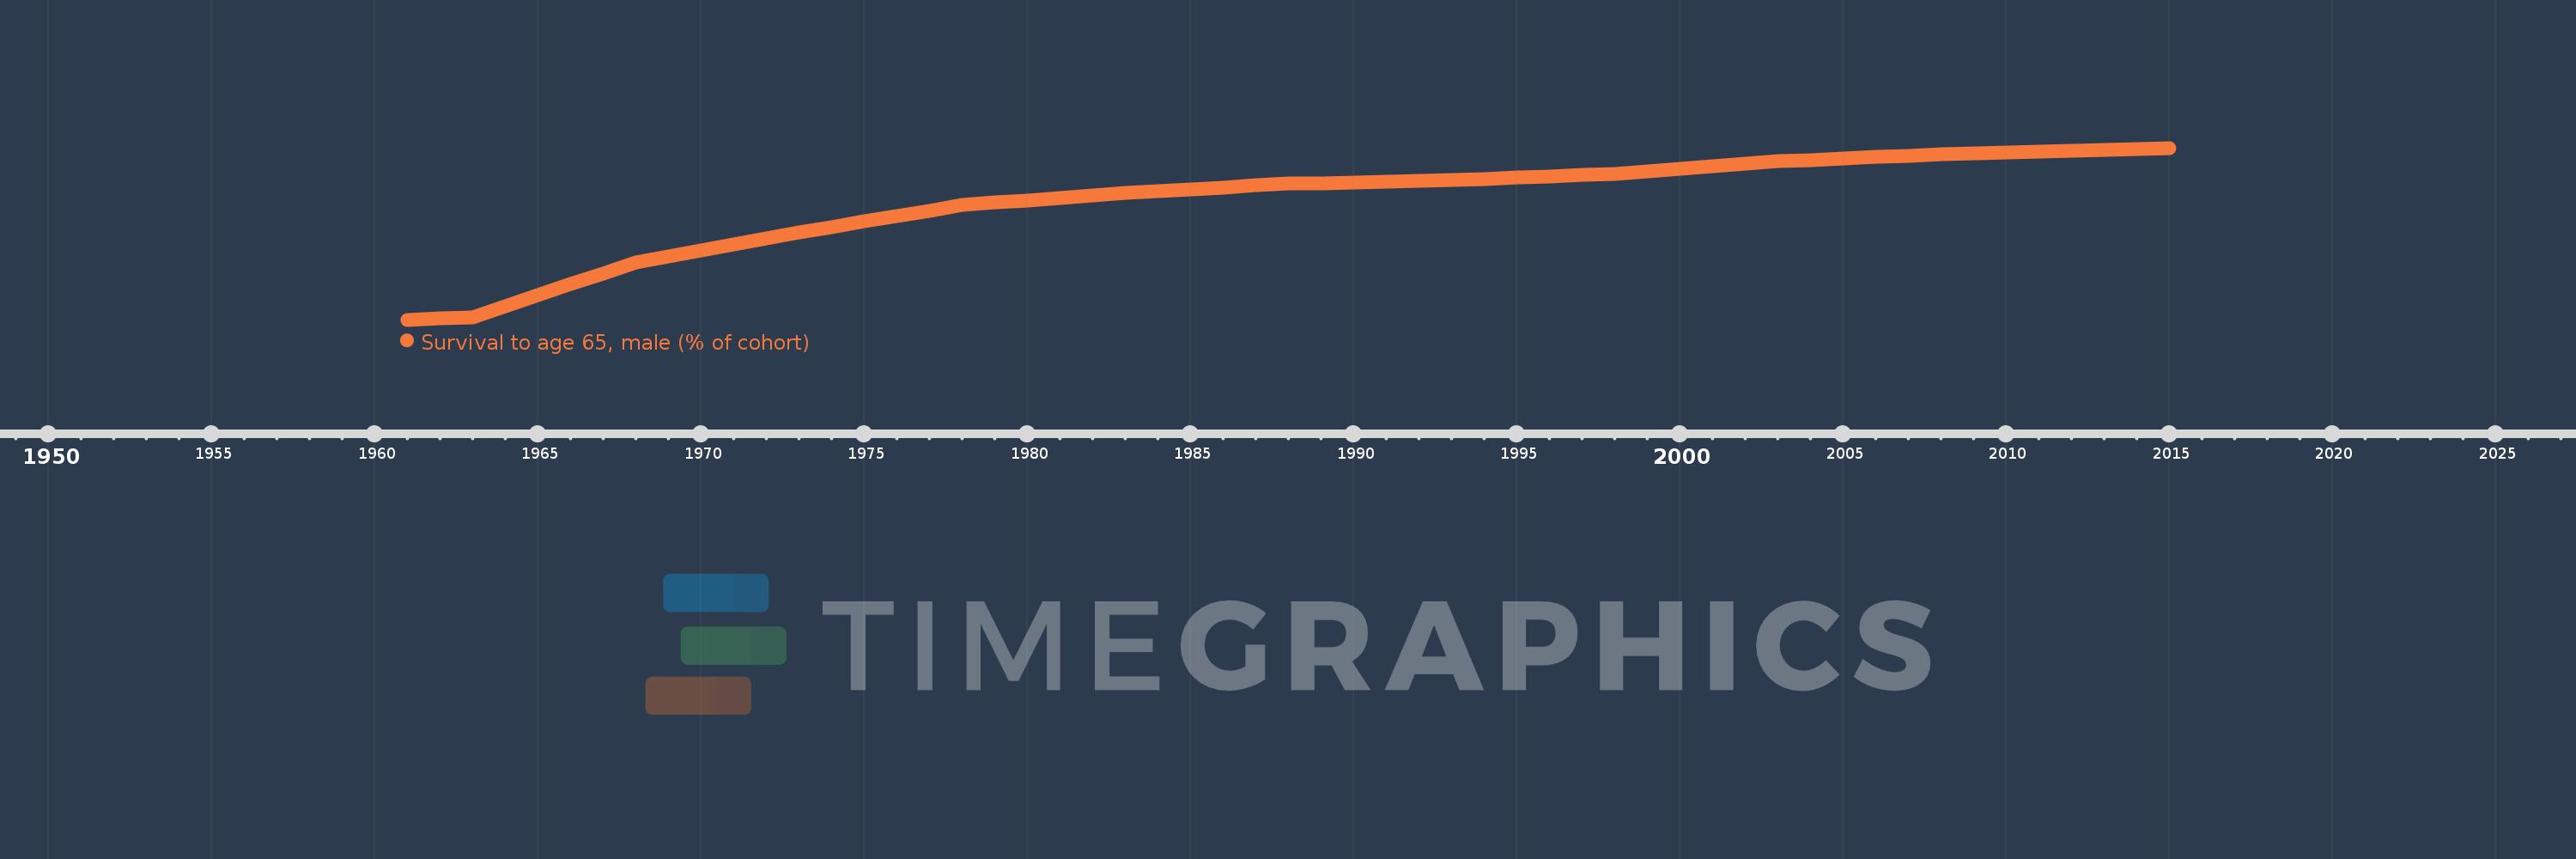
Survival to age 65, male (% of cohort)
2015,2014,2013,2012,2011,2010,2009,2008,2007,2006,2005,2004,2003,2002,2001,2000,1999,1998,1997,1996,1995,1994,1993,1992,1991,1990,1989,1988,1987,1986,1985,1984,1983,1982,1981,1980,1979,1978,1977,1976,1975,1974,1973,1972,1971,1970,1969,1968,1967,1966,1965,1964,1963,1962,1961
This statistics in other country:
AfghanistanAlbaniaAlgeriaAngolaAntigua and BarbudaArab WorldArgentinaArmeniaArubaAustraliaAustriaAzerbaijanBahamas, TheBahrainBangladeshBarbadosBelarusBelgiumBelizeBeninBhutanBoliviaBosnia and HerzegovinaBotswanaBrazilBrunei DarussalamBulgariaBurkina FasoBurundiCabo VerdeCambodiaCameroonCanadaCaribbean small statesCentral African RepublicCentral Europe and the BalticsChadChannel IslandsChileChinaColombiaComorosCongo, Dem. Rep.Congo, Rep.Costa RicaCote d'IvoireCroatiaCubaCuracaoCyprusCzech RepublicDenmarkDjiboutiDominican RepublicEarly-demographic dividendEast Asia & PacificEast Asia & Pacific (excluding high income)East Asia & Pacific (IDA & IBRD countries)EcuadorEgypt, Arab Rep.El SalvadorEquatorial GuineaEritreaEstoniaEthiopiaEuro areaEurope & Central AsiaEurope & Central Asia (excluding high income)Europe & Central Asia (IDA & IBRD countries)European UnionFijiFinlandFragile and conflict affected situationsFranceFrench PolynesiaGabonGambia, TheGeorgiaGermanyGhanaGreeceGrenadaGuamGuatemalaGuineaGuinea-BissauGuyanaHaitiHeavily indebted poor countries (HIPC)High incomeHondurasHong Kong SAR, ChinaHungaryIBRD onlyIcelandIDA & IBRD totalIDA blendIDA onlyIDA totalIndiaIndonesiaIran, Islamic Rep.IraqIrelandIsraelItalyJamaicaJapanJordanKazakhstanKenyaKiribatiKorea, Dem. People’s Rep.Korea, Rep.KuwaitKyrgyz RepublicLao PDRLate-demographic dividendLatin America & Caribbean Latin America & Caribbean (excluding high income)Latin America & the Caribbean (IDA & IBRD countries)LatviaLeast developed countries: UN classificationLebanonLesothoLiberiaLibyaLithuaniaLow & middle incomeLow incomeLower middle incomeLuxembourgMacao SAR, ChinaMacedonia, FYRMadagascarMalawiMalaysiaMaldivesMaliMaltaMauritaniaMauritiusMexicoMicronesia, Fed. Sts.Middle East & North AfricaMiddle East & North Africa (excluding high income)Middle East & North Africa (IDA & IBRD countries)Middle incomeMoldovaMongoliaMontenegroMoroccoMozambiqueMyanmarNamibiaNepalNetherlandsNew CaledoniaNew ZealandNicaraguaNigerNigeriaNorth AmericaNorwayOECD membersOmanOther small statesPacific island small statesPakistanPanamaPapua New GuineaParaguayPeruPhilippinesPolandPortugalPost-demographic dividendPre-demographic dividendPuerto RicoQatarRomaniaRussian FederationRwandaSamoaSao Tome and PrincipeSaudi ArabiaSenegalSerbiaSeychellesSierra LeoneSingaporeSlovak RepublicSloveniaSmall statesSolomon IslandsSomaliaSouth AfricaSouth AsiaSouth Asia (IDA & IBRD)South SudanSpainSri LankaSt. LuciaSt. Vincent and the GrenadinesSub-Saharan Africa Sub-Saharan Africa (excluding high income)Sub-Saharan Africa (IDA & IBRD countries)SudanSurinameSwazilandSwedenSwitzerlandSyrian Arab RepublicTajikistanTanzaniaThailandTimor-LesteTogoTongaTrinidad and TobagoTunisiaTurkeyTurkmenistanUgandaUkraineUnited Arab EmiratesUnited KingdomUnited StatesUpper middle incomeUruguayUzbekistanVanuatuVenezuela, RBVietnamVirgin Islands (U.S.)West Bank and GazaWorldYemen, Rep.ZambiaZimbabwe Timeline:
This timeline shows a graph from 1961 to 2015 of East Asia & Pacific (IDA & IBRD countries). No data until 1960. Number of actual observations by date: 55.
Source name:
World Development Indicators
Source organization:
United Nations Population Division. World Population Prospects. New York, United Nations, Department of Economic and Social Affairs (advanced Excel tables). Available at http://esa.un.org/wpp/unpp/panel_population.htm.
Categories, topics:
Health, Gender
Last updated:
apr 23, 2017
Indicators value changes by year
Minimum:
29.699
jan 1, 1961
Maximum:
78.002
jan 1, 2015
At the date of observation
Value
Absolute change
Change from previous value
jan 1, 1961
29.699
+29.699
0.0%
jan 1, 1962
30.08
+0.38
1.28%
jan 1, 1963
30.422
+0.342
1.14%
jan 1, 1964
33.509
+3.088
10.15%
jan 1, 1965
36.594
+3.085
9.21%
jan 1, 1966
39.67
+3.076
8.41%
jan 1, 1967
42.751
+3.08
7.76%
jan 1, 1968
45.831
+3.081
7.21%
jan 1, 1969
47.516
+1.685
3.68%
jan 1, 1970
49.205
+1.689
3.55%
jan 1, 1971
50.896
+1.691
3.44%
jan 1, 1972
52.586
+1.69
3.32%
jan 1, 1973
54.27
+1.684
3.2%
jan 1, 1974
55.787
+1.517
2.8%
jan 1, 1975
57.304
+1.517
2.72%
jan 1, 1976
58.821
+1.517
2.65%
jan 1, 1977
60.35
+1.529
2.6%
jan 1, 1978
61.883
+1.533
2.54%
jan 1, 1979
62.596
+0.713
1.15%
jan 1, 1980
63.306
+0.71
1.13%
jan 1, 1981
64.009
+0.703
1.11%
jan 1, 1982
64.709
+0.7
1.09%
jan 1, 1983
65.408
+0.699
1.08%
jan 1, 1984
65.921
+0.512
0.78%
jan 1, 1985
66.427
+0.507
0.77%
jan 1, 1986
66.932
+0.504
0.76%
jan 1, 1987
67.436
+0.504
0.75%
jan 1, 1988
67.937
+0.501
0.74%
jan 1, 1989
68.146
+0.21
0.31%
jan 1, 1990
68.354
+0.208
0.3%
jan 1, 1991
68.562
+0.209
0.31%
jan 1, 1992
68.762
+0.2
0.29%
jan 1, 1993
68.969
+0.206
0.3%
jan 1, 1994
69.326
+0.358
0.52%
jan 1, 1995
69.681
+0.355
0.51%
jan 1, 1996
70.032
+0.35
0.5%
jan 1, 1997
70.393
+0.361
0.52%
jan 1, 1998
70.746
+0.353
0.5%
jan 1, 1999
71.443
+0.697
0.99%
jan 1, 2000
72.142
+0.698
0.98%
jan 1, 2001
72.846
+0.705
0.98%
jan 1, 2002
73.558
+0.712
0.98%
jan 1, 2003
74.277
+0.718
0.98%
jan 1, 2004
74.665
+0.388
0.52%
jan 1, 2005
75.051
+0.386
0.52%
jan 1, 2006
75.432
+0.381
0.51%
jan 1, 2007
75.798
+0.366
0.48%
jan 1, 2008
76.162
+0.364
0.48%
jan 1, 2009
76.427
+0.265
0.35%
jan 1, 2010
76.687
+0.26
0.34%
jan 1, 2011
76.942
+0.255
0.33%
jan 1, 2012
77.192
+0.25
0.33%
jan 1, 2013
77.439
+0.247
0.32%
jan 1, 2014
77.721
+0.283
0.36%
jan 1, 2015
78.002
+0.28
0.36%
Ranking of countries by current statistics by years


Comments: