29
/
en
AIzaSyAYiBZKx7MnpbEhh9jyipgxe19OcubqV5w
April 1, 2024
31164
Europe & Central Asia
ECS
false
2
1
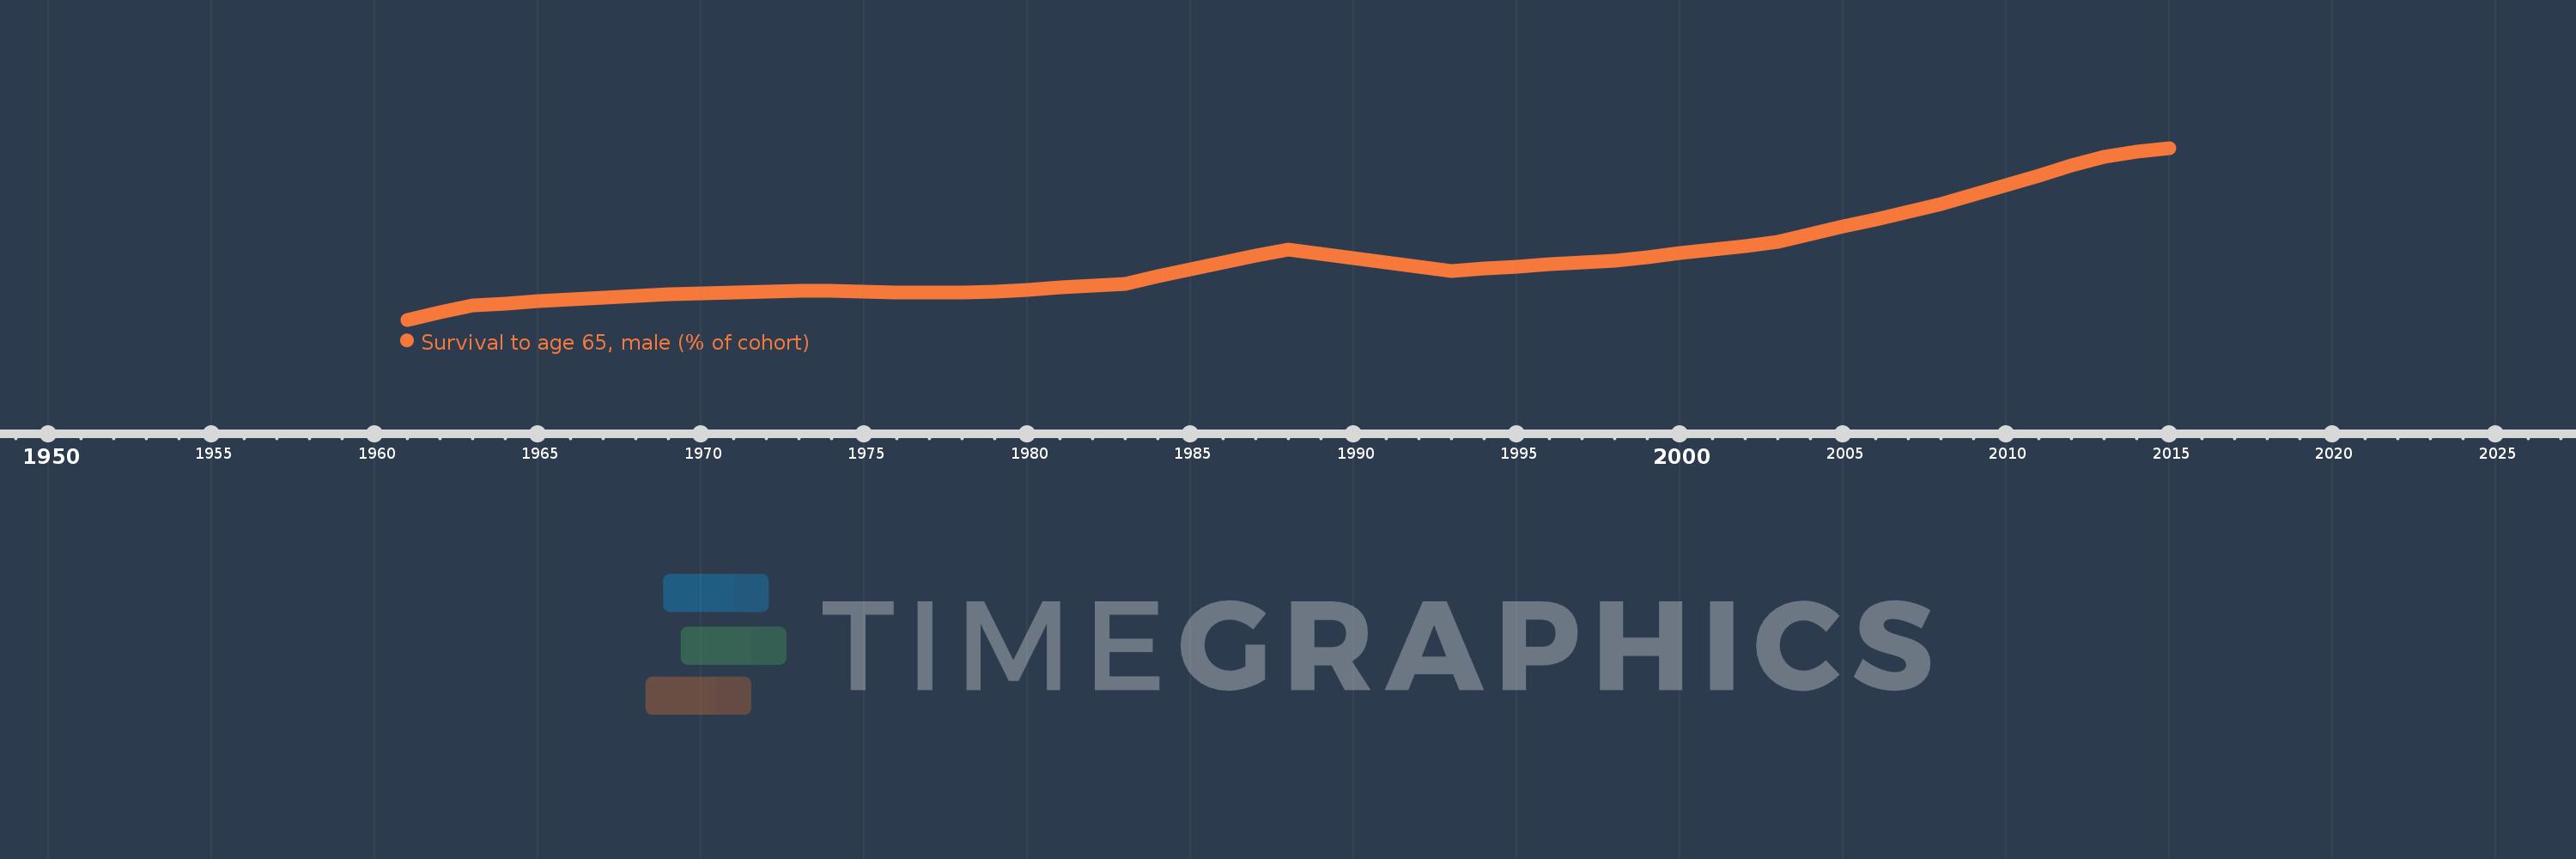
Survival to age 65, male (% of cohort)
2015,2014,2013,2012,2011,2010,2009,2008,2007,2006,2005,2004,2003,2002,2001,2000,1999,1998,1997,1996,1995,1994,1993,1992,1991,1990,1989,1988,1987,1986,1985,1984,1983,1982,1981,1980,1979,1978,1977,1976,1975,1974,1973,1972,1971,1970,1969,1968,1967,1966,1965,1964,1963,1962,1961
This statistics in other country:
AfghanistanAlbaniaAlgeriaAngolaAntigua and BarbudaArab WorldArgentinaArmeniaArubaAustraliaAustriaAzerbaijanBahamas, TheBahrainBangladeshBarbadosBelarusBelgiumBelizeBeninBhutanBoliviaBosnia and HerzegovinaBotswanaBrazilBrunei DarussalamBulgariaBurkina FasoBurundiCabo VerdeCambodiaCameroonCanadaCaribbean small statesCentral African RepublicCentral Europe and the BalticsChadChannel IslandsChileChinaColombiaComorosCongo, Dem. Rep.Congo, Rep.Costa RicaCote d'IvoireCroatiaCubaCuracaoCyprusCzech RepublicDenmarkDjiboutiDominican RepublicEarly-demographic dividendEast Asia & PacificEast Asia & Pacific (excluding high income)East Asia & Pacific (IDA & IBRD countries)EcuadorEgypt, Arab Rep.El SalvadorEquatorial GuineaEritreaEstoniaEthiopiaEuro areaEurope & Central AsiaEurope & Central Asia (excluding high income)Europe & Central Asia (IDA & IBRD countries)European UnionFijiFinlandFragile and conflict affected situationsFranceFrench PolynesiaGabonGambia, TheGeorgiaGermanyGhanaGreeceGrenadaGuamGuatemalaGuineaGuinea-BissauGuyanaHaitiHeavily indebted poor countries (HIPC)High incomeHondurasHong Kong SAR, ChinaHungaryIBRD onlyIcelandIDA & IBRD totalIDA blendIDA onlyIDA totalIndiaIndonesiaIran, Islamic Rep.IraqIrelandIsraelItalyJamaicaJapanJordanKazakhstanKenyaKiribatiKorea, Dem. People’s Rep.Korea, Rep.KuwaitKyrgyz RepublicLao PDRLate-demographic dividendLatin America & Caribbean Latin America & Caribbean (excluding high income)Latin America & the Caribbean (IDA & IBRD countries)LatviaLeast developed countries: UN classificationLebanonLesothoLiberiaLibyaLithuaniaLow & middle incomeLow incomeLower middle incomeLuxembourgMacao SAR, ChinaMacedonia, FYRMadagascarMalawiMalaysiaMaldivesMaliMaltaMauritaniaMauritiusMexicoMicronesia, Fed. Sts.Middle East & North AfricaMiddle East & North Africa (excluding high income)Middle East & North Africa (IDA & IBRD countries)Middle incomeMoldovaMongoliaMontenegroMoroccoMozambiqueMyanmarNamibiaNepalNetherlandsNew CaledoniaNew ZealandNicaraguaNigerNigeriaNorth AmericaNorwayOECD membersOmanOther small statesPacific island small statesPakistanPanamaPapua New GuineaParaguayPeruPhilippinesPolandPortugalPost-demographic dividendPre-demographic dividendPuerto RicoQatarRomaniaRussian FederationRwandaSamoaSao Tome and PrincipeSaudi ArabiaSenegalSerbiaSeychellesSierra LeoneSingaporeSlovak RepublicSloveniaSmall statesSolomon IslandsSomaliaSouth AfricaSouth AsiaSouth Asia (IDA & IBRD)South SudanSpainSri LankaSt. LuciaSt. Vincent and the GrenadinesSub-Saharan Africa Sub-Saharan Africa (excluding high income)Sub-Saharan Africa (IDA & IBRD countries)SudanSurinameSwazilandSwedenSwitzerlandSyrian Arab RepublicTajikistanTanzaniaThailandTimor-LesteTogoTongaTrinidad and TobagoTunisiaTurkeyTurkmenistanUgandaUkraineUnited Arab EmiratesUnited KingdomUnited StatesUpper middle incomeUruguayUzbekistanVanuatuVenezuela, RBVietnamVirgin Islands (U.S.)West Bank and GazaWorldYemen, Rep.ZambiaZimbabwe Timeline:
This timeline shows a graph from 1961 to 2015 of Europe & Central Asia. No data until 1960. Number of actual observations by date: 55.
Source name:
World Development Indicators
Source organization:
United Nations Population Division. World Population Prospects. New York, United Nations, Department of Economic and Social Affairs (advanced Excel tables). Available at http://esa.un.org/wpp/unpp/panel_population.htm.
Categories, topics:
Health, Gender
Last updated:
apr 23, 2017
Indicators value changes by year
Minimum:
62.855
jan 1, 1961
Maximum:
75.076
jan 1, 2015
At the date of observation
Value
Absolute change
Change from previous value
jan 1, 1961
62.855
+62.855
0.0%
jan 1, 1962
63.36
+0.506
0.8%
jan 1, 1963
63.868
+0.508
0.8%
jan 1, 1964
64.019
+0.151
0.24%
jan 1, 1965
64.165
+0.146
0.23%
jan 1, 1966
64.304
+0.139
0.22%
jan 1, 1967
64.44
+0.137
0.21%
jan 1, 1968
64.57
+0.13
0.2%
jan 1, 1969
64.644
+0.074
0.11%
jan 1, 1970
64.715
+0.071
0.11%
jan 1, 1971
64.786
+0.07
0.11%
jan 1, 1972
64.851
+0.065
0.1%
jan 1, 1973
64.922
+0.071
0.11%
jan 1, 1974
64.886
-0.036
-0.06%
jan 1, 1975
64.851
-0.035
-0.05%
jan 1, 1976
64.816
-0.035
-0.05%
jan 1, 1977
64.791
-0.025
-0.04%
jan 1, 1978
64.764
-0.027
-0.04%
jan 1, 1979
64.879
+0.115
0.18%
jan 1, 1980
65.002
+0.123
0.19%
jan 1, 1981
65.137
+0.135
0.21%
jan 1, 1982
65.275
+0.138
0.21%
jan 1, 1983
65.422
+0.147
0.22%
jan 1, 1984
65.925
+0.503
0.77%
jan 1, 1985
66.419
+0.494
0.75%
jan 1, 1986
66.906
+0.487
0.73%
jan 1, 1987
67.39
+0.484
0.72%
jan 1, 1988
67.869
+0.479
0.71%
jan 1, 1989
67.543
-0.326
-0.48%
jan 1, 1990
67.22
-0.323
-0.48%
jan 1, 1991
66.91
-0.309
-0.46%
jan 1, 1992
66.614
-0.296
-0.44%
jan 1, 1993
66.328
-0.286
-0.43%
jan 1, 1994
66.488
+0.16
0.24%
jan 1, 1995
66.646
+0.158
0.24%
jan 1, 1996
66.795
+0.149
0.22%
jan 1, 1997
66.933
+0.138
0.21%
jan 1, 1998
67.073
+0.14
0.21%
jan 1, 1999
67.32
+0.247
0.37%
jan 1, 2000
67.573
+0.253
0.38%
jan 1, 2001
67.832
+0.259
0.38%
jan 1, 2002
68.122
+0.29
0.43%
jan 1, 2003
68.419
+0.297
0.44%
jan 1, 2004
68.957
+0.538
0.79%
jan 1, 2005
69.489
+0.531
0.77%
jan 1, 2006
70.013
+0.524
0.75%
jan 1, 2007
70.541
+0.528
0.75%
jan 1, 2008
71.062
+0.521
0.74%
jan 1, 2009
71.758
+0.696
0.98%
jan 1, 2010
72.44
+0.681
0.95%
jan 1, 2011
73.122
+0.683
0.94%
jan 1, 2012
73.807
+0.685
0.94%
jan 1, 2013
74.476
+0.669
0.91%
jan 1, 2014
74.791
+0.315
0.42%
jan 1, 2015
75.076
+0.285
0.38%
Ranking of countries by current statistics by years


Comments: