29
/
en
AIzaSyAYiBZKx7MnpbEhh9jyipgxe19OcubqV5w
April 1, 2024
218287
Panama
PAN
true
2
1
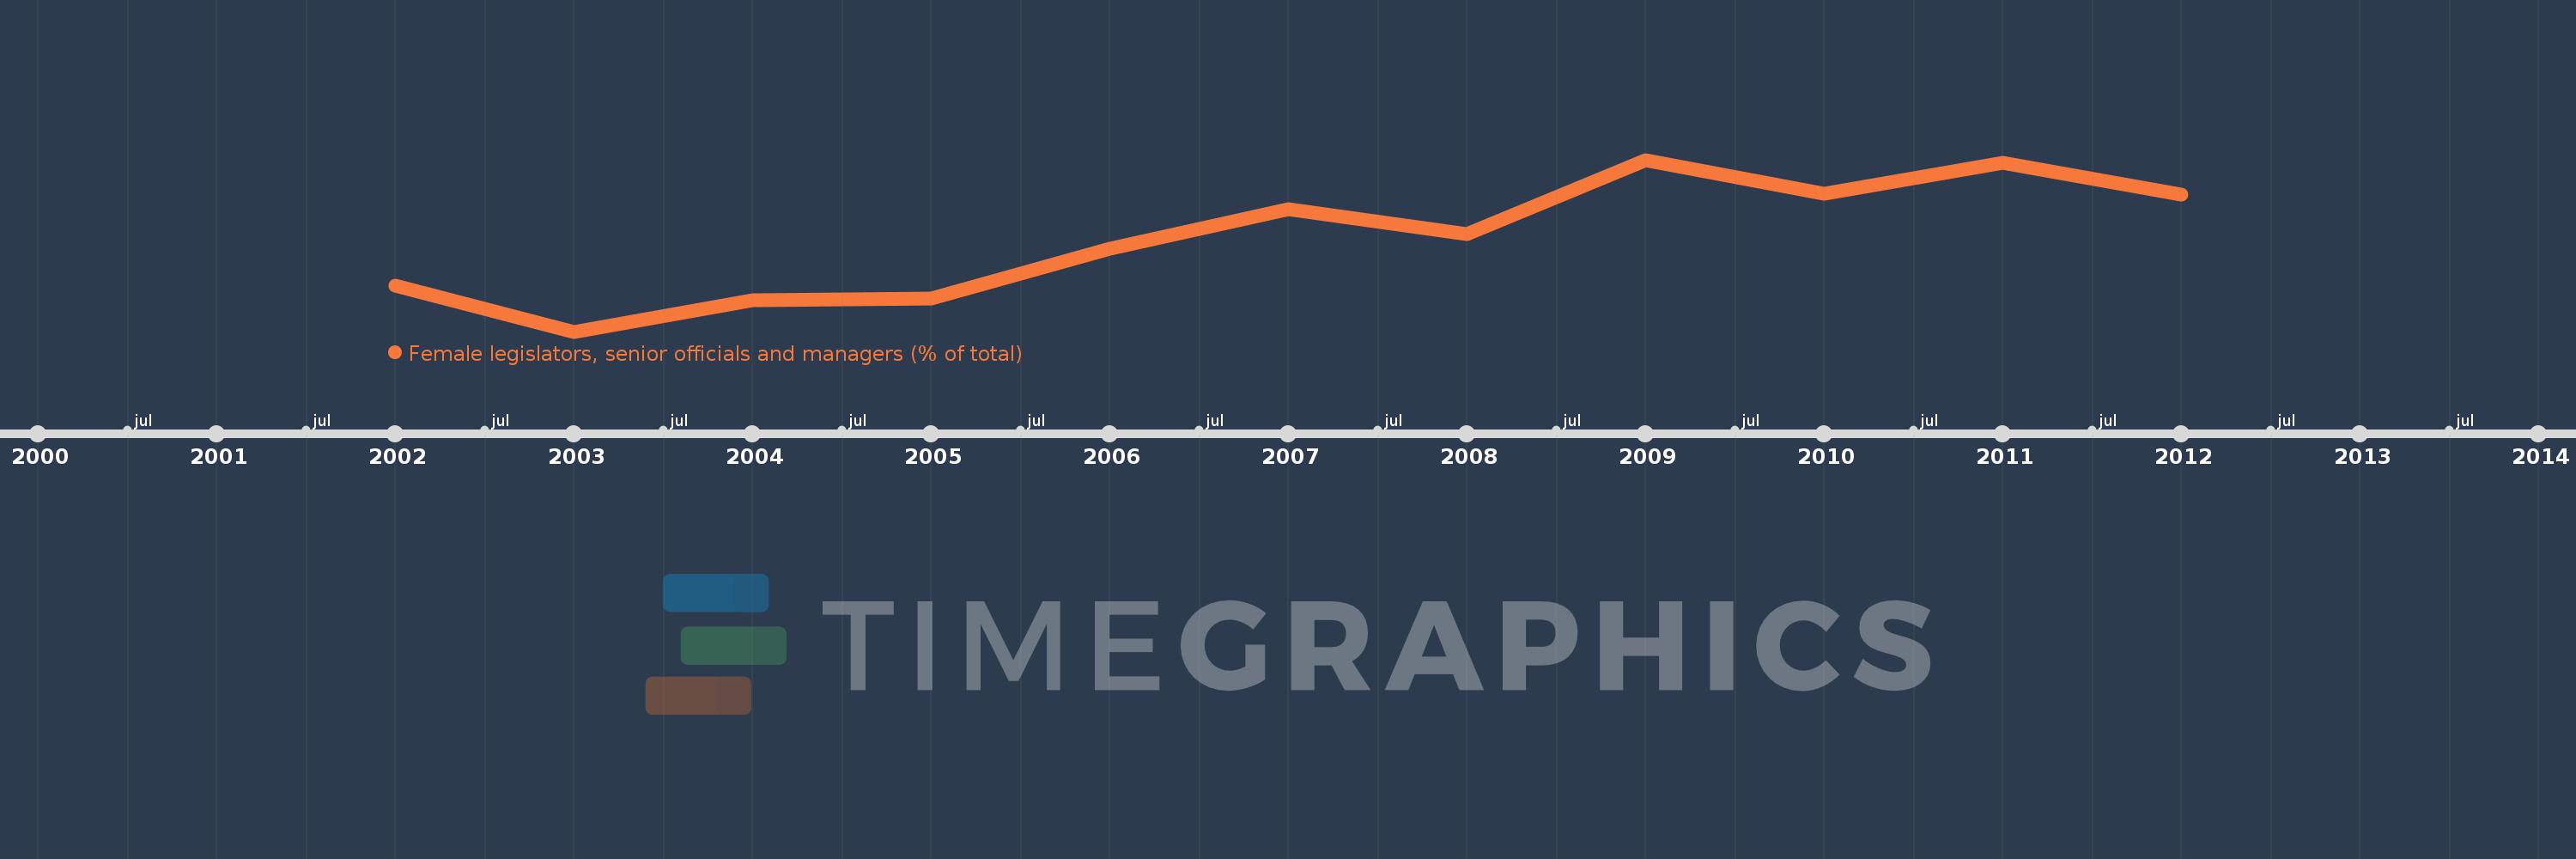
Female legislators, senior officials and managers (% of total)
2012,2011,2010,2009,2008,2007,2006,2005,2004,2003,2002
This statistics in other country:
Timeline:
This timeline shows a graph from 2002 to 2012 of Panama. No data until 2001. Number of actual observations by date: 11.
Source name:
World Development Indicators
Source organization:
ILO Key Indicators of the Labour Market (KILM).
Categories, topics:
Public Sector, Gender
Last updated:
apr 23, 2017
Indicators value changes by year
Minimum:
37.613
jan 1, 2003
Maximum:
48.077
jan 1, 2009
At the date of observation
Value
Absolute change
Change from previous value
jan 1, 2002
40.388
+40.388
0.0%
jan 1, 2003
37.613
-2.775
-6.87%
jan 1, 2004
39.532
+1.919
5.1%
jan 1, 2005
39.641
+0.109
0.28%
jan 1, 2006
42.662
+3.021
7.62%
jan 1, 2007
45.049
+2.387
5.6%
jan 1, 2008
43.548
-1.501
-3.33%
jan 1, 2009
48.077
+4.529
10.4%
jan 1, 2010
46.007
-2.07
-4.31%
jan 1, 2011
47.897
+1.89
4.11%
jan 1, 2012
45.971
-1.926
-4.02%
Ranking of countries by current statistics by years


Comments: