29
/
en
AIzaSyAYiBZKx7MnpbEhh9jyipgxe19OcubqV5w
April 1, 2024
122076
Dominican Republic
DOM
true
2
1
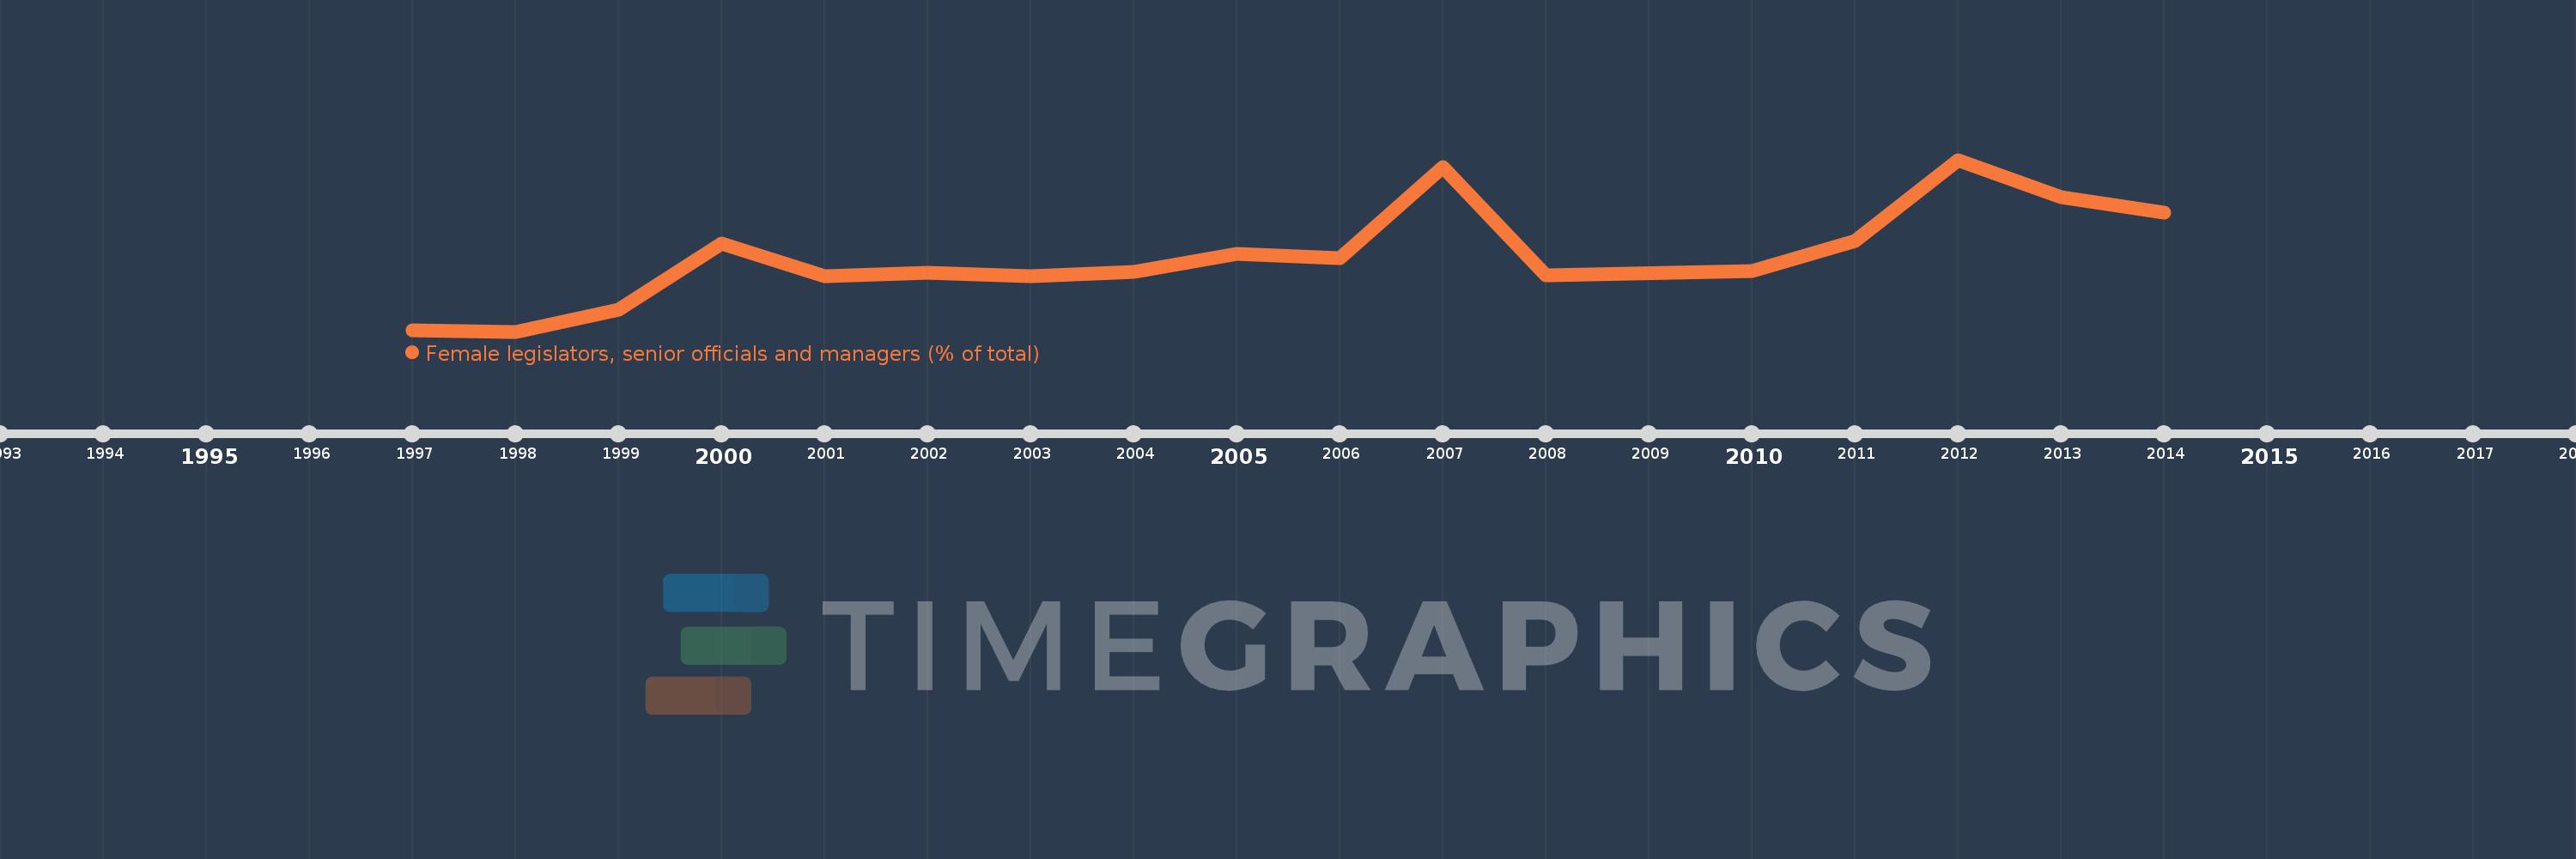
Female legislators, senior officials and managers (% of total)
2014,2013,2012,2011,2010,2008,2007,2006,2005,2004,2003,2002,2001,2000,1999,1998,1997
This statistics in other country:
Timeline:
This timeline shows a graph from 1997 to 2014 of Dominican Republic. No data until 1996. Number of actual observations by date: 17.
Source name:
World Development Indicators
Source organization:
ILO Key Indicators of the Labour Market (KILM).
Categories, topics:
Public Sector, Gender
Last updated:
apr 23, 2017
Indicators value changes by year
Minimum:
24.902
jan 1, 1998
Maximum:
42.426
jan 1, 2012
At the date of observation
Value
Absolute change
Change from previous value
jan 1, 1997
25.0
+25.0
0.0%
jan 1, 1998
24.902
-0.098
-0.39%
jan 1, 1999
27.128
+2.226
8.94%
jan 1, 2000
33.894
+6.765
24.94%
jan 1, 2001
30.591
-3.303
-9.74%
jan 1, 2002
30.911
+0.32
1.05%
jan 1, 2003
30.556
-0.355
-1.15%
jan 1, 2004
31.012
+0.456
1.49%
jan 1, 2005
32.81
+1.798
5.8%
jan 1, 2006
32.432
-0.378
-1.15%
jan 1, 2007
41.721
+9.289
28.64%
jan 1, 2008
30.613
-11.108
-26.63%
jan 1, 2010
31.039
+0.426
1.39%
jan 1, 2011
34.118
+3.079
9.92%
jan 1, 2012
42.426
+8.308
24.35%
jan 1, 2013
38.588
-3.838
-9.05%
jan 1, 2014
37.017
-1.571
-4.07%
Ranking of countries by current statistics by years


Comments: