29
/
en
AIzaSyAYiBZKx7MnpbEhh9jyipgxe19OcubqV5w
April 1, 2024
182037
Luxembourg
LUX
true
2
1
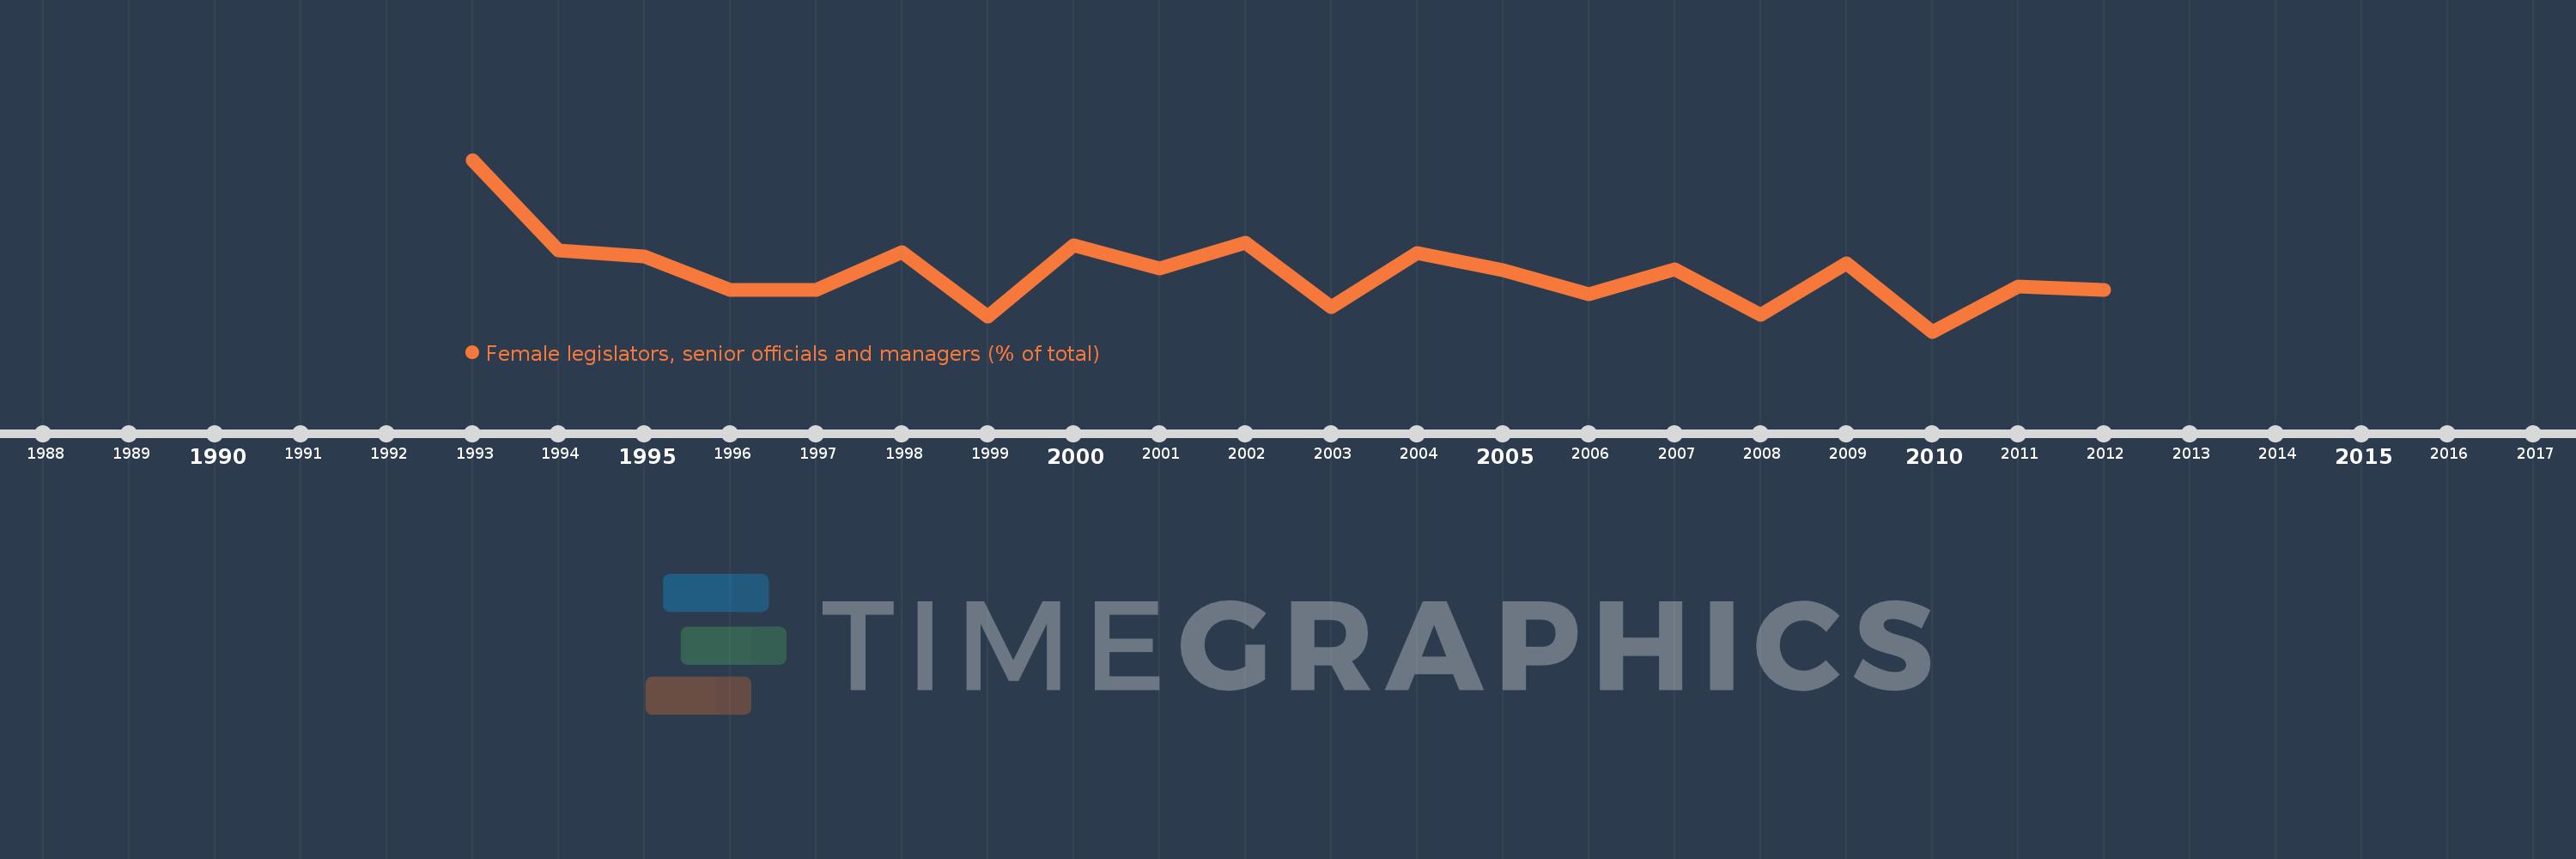
Female legislators, senior officials and managers (% of total)
2012,2011,2010,2009,2008,2007,2006,2005,2004,2003,2002,2001,2000,1999,1998,1997,1996,1995,1994,1993
This statistics in other country:
Timeline:
This timeline shows a graph from 1993 to 2012 of Luxembourg. No data until 1992. Number of actual observations by date: 20.
Source name:
World Development Indicators
Source organization:
ILO Key Indicators of the Labour Market (KILM).
Categories, topics:
Public Sector, Gender
Last updated:
apr 23, 2017
Indicators value changes by year
Minimum:
19.097
jan 1, 2010
Maximum:
40.381
jan 1, 1993
At the date of observation
Value
Absolute change
Change from previous value
jan 1, 1993
40.381
+40.381
0.0%
jan 1, 1994
29.114
-11.267
-27.9%
jan 1, 1995
28.366
-0.748
-2.57%
jan 1, 1996
24.297
-4.069
-14.34%
jan 1, 1997
24.281
-0.016
-0.07%
jan 1, 1998
28.951
+4.67
19.23%
jan 1, 1999
20.954
-7.997
-27.62%
jan 1, 2000
29.826
+8.872
42.34%
jan 1, 2001
26.915
-2.911
-9.76%
jan 1, 2002
30.149
+3.233
12.01%
jan 1, 2003
22.077
-8.071
-26.77%
jan 1, 2004
28.817
+6.74
30.53%
jan 1, 2005
26.702
-2.115
-7.34%
jan 1, 2006
23.772
-2.93
-10.97%
jan 1, 2007
26.76
+2.988
12.57%
jan 1, 2008
21.17
-5.59
-20.89%
jan 1, 2009
27.523
+6.353
30.01%
jan 1, 2010
19.097
-8.426
-30.61%
jan 1, 2011
24.696
+5.599
29.32%
jan 1, 2012
24.211
-0.485
-1.97%
Ranking of countries by current statistics by years


Comments: