29
/
en
AIzaSyAYiBZKx7MnpbEhh9jyipgxe19OcubqV5w
April 1, 2024
194175
Mauritius
MUS
true
2
1
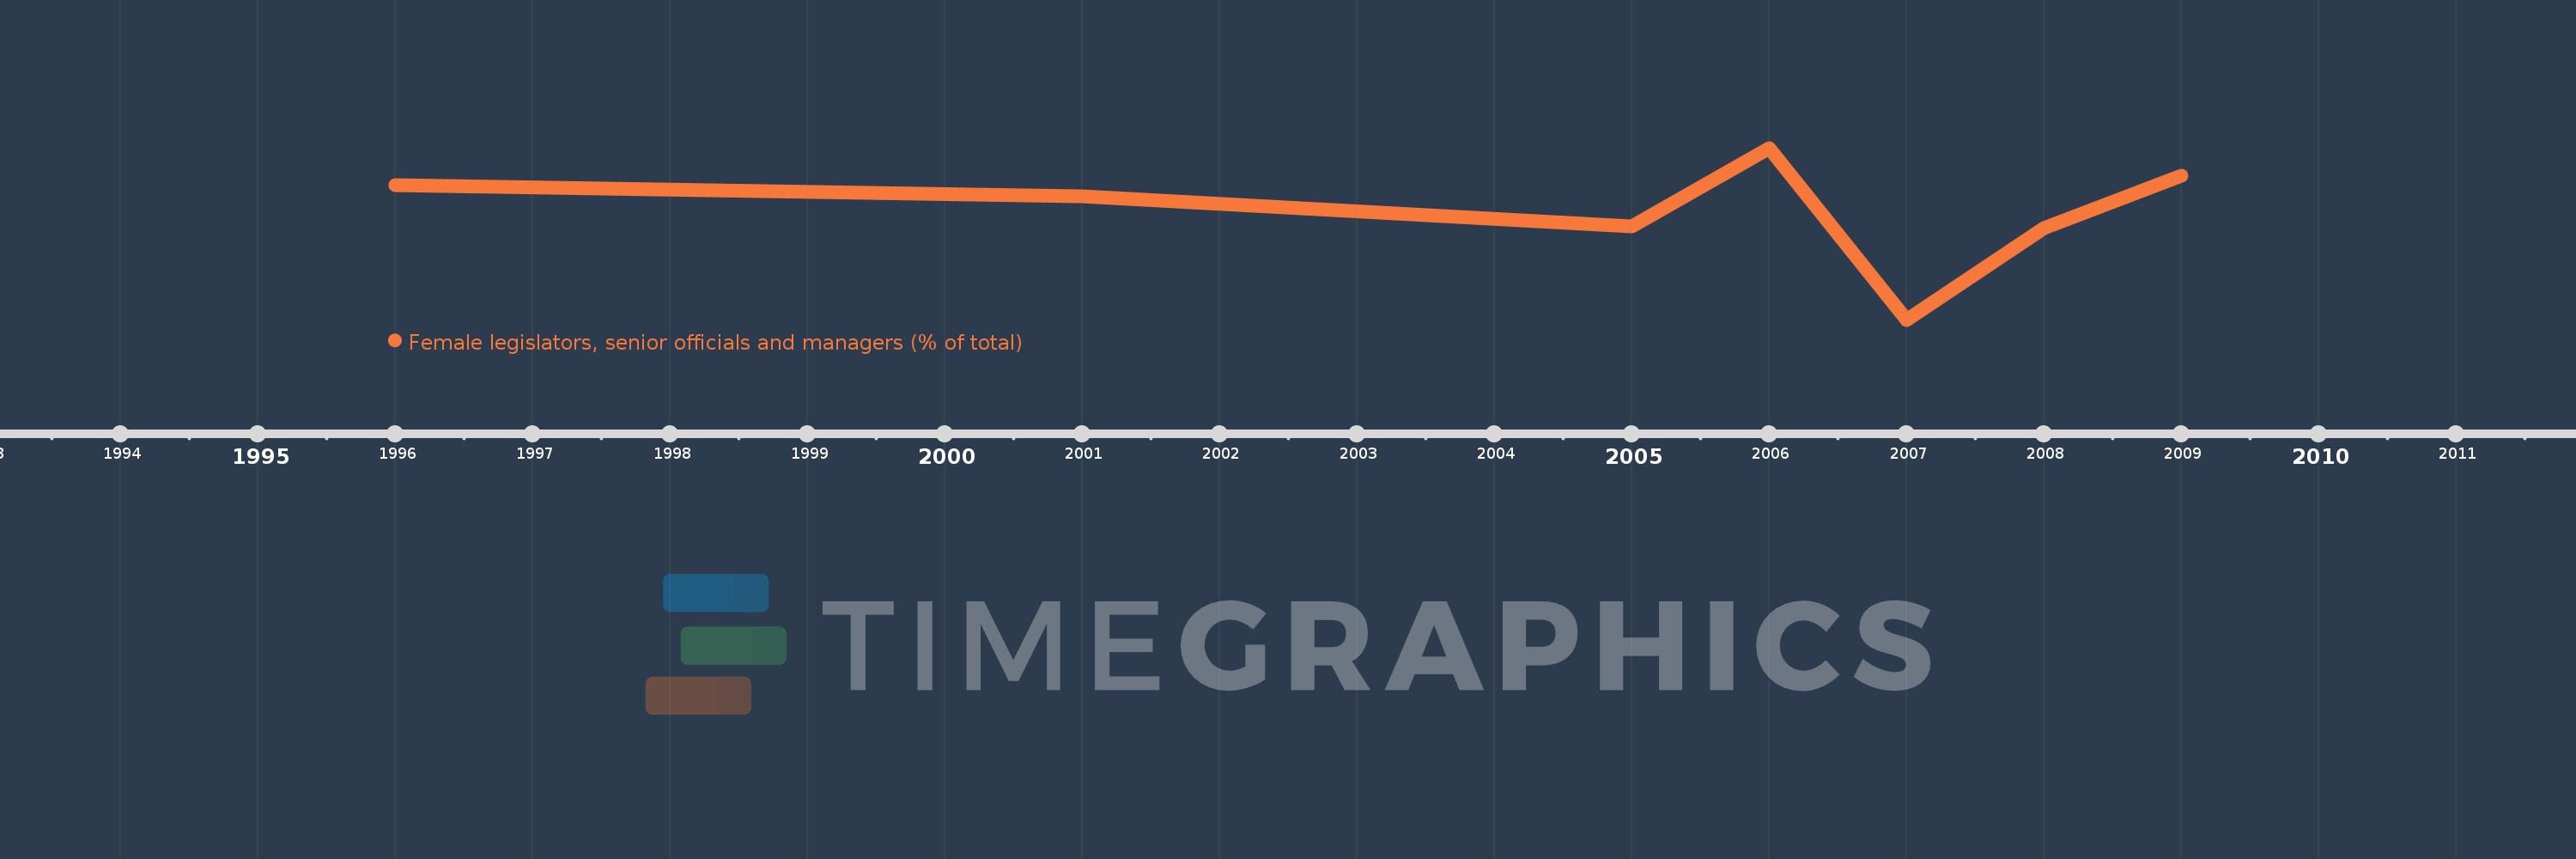
Female legislators, senior officials and managers (% of total)
2009,2008,2007,2006,2005,2001,1996
This statistics in other country:
Timeline:
This timeline shows a graph from 1996 to 2009 of Mauritius. No data until 1995. Number of actual observations by date: 7.
Source name:
World Development Indicators
Source organization:
ILO Key Indicators of the Labour Market (KILM).
Categories, topics:
Public Sector, Gender
Last updated:
apr 23, 2017
Indicators value changes by year
Minimum:
15.278
jan 1, 2007
Maximum:
24.638
jan 1, 2006
At the date of observation
Value
Absolute change
Change from previous value
jan 1, 1996
22.609
+22.609
0.0%
jan 1, 2001
22.026
-0.583
-2.58%
jan 1, 2005
20.382
-1.644
-7.46%
jan 1, 2006
24.638
+4.256
20.88%
jan 1, 2007
15.278
-9.36
-37.99%
jan 1, 2008
20.27
+4.992
32.68%
jan 1, 2009
23.129
+2.859
14.1%
Ranking of countries by current statistics by years


Comments: