29
/
en
AIzaSyAYiBZKx7MnpbEhh9jyipgxe19OcubqV5w
April 1, 2024
201520
Morocco
MAR
true
2
1
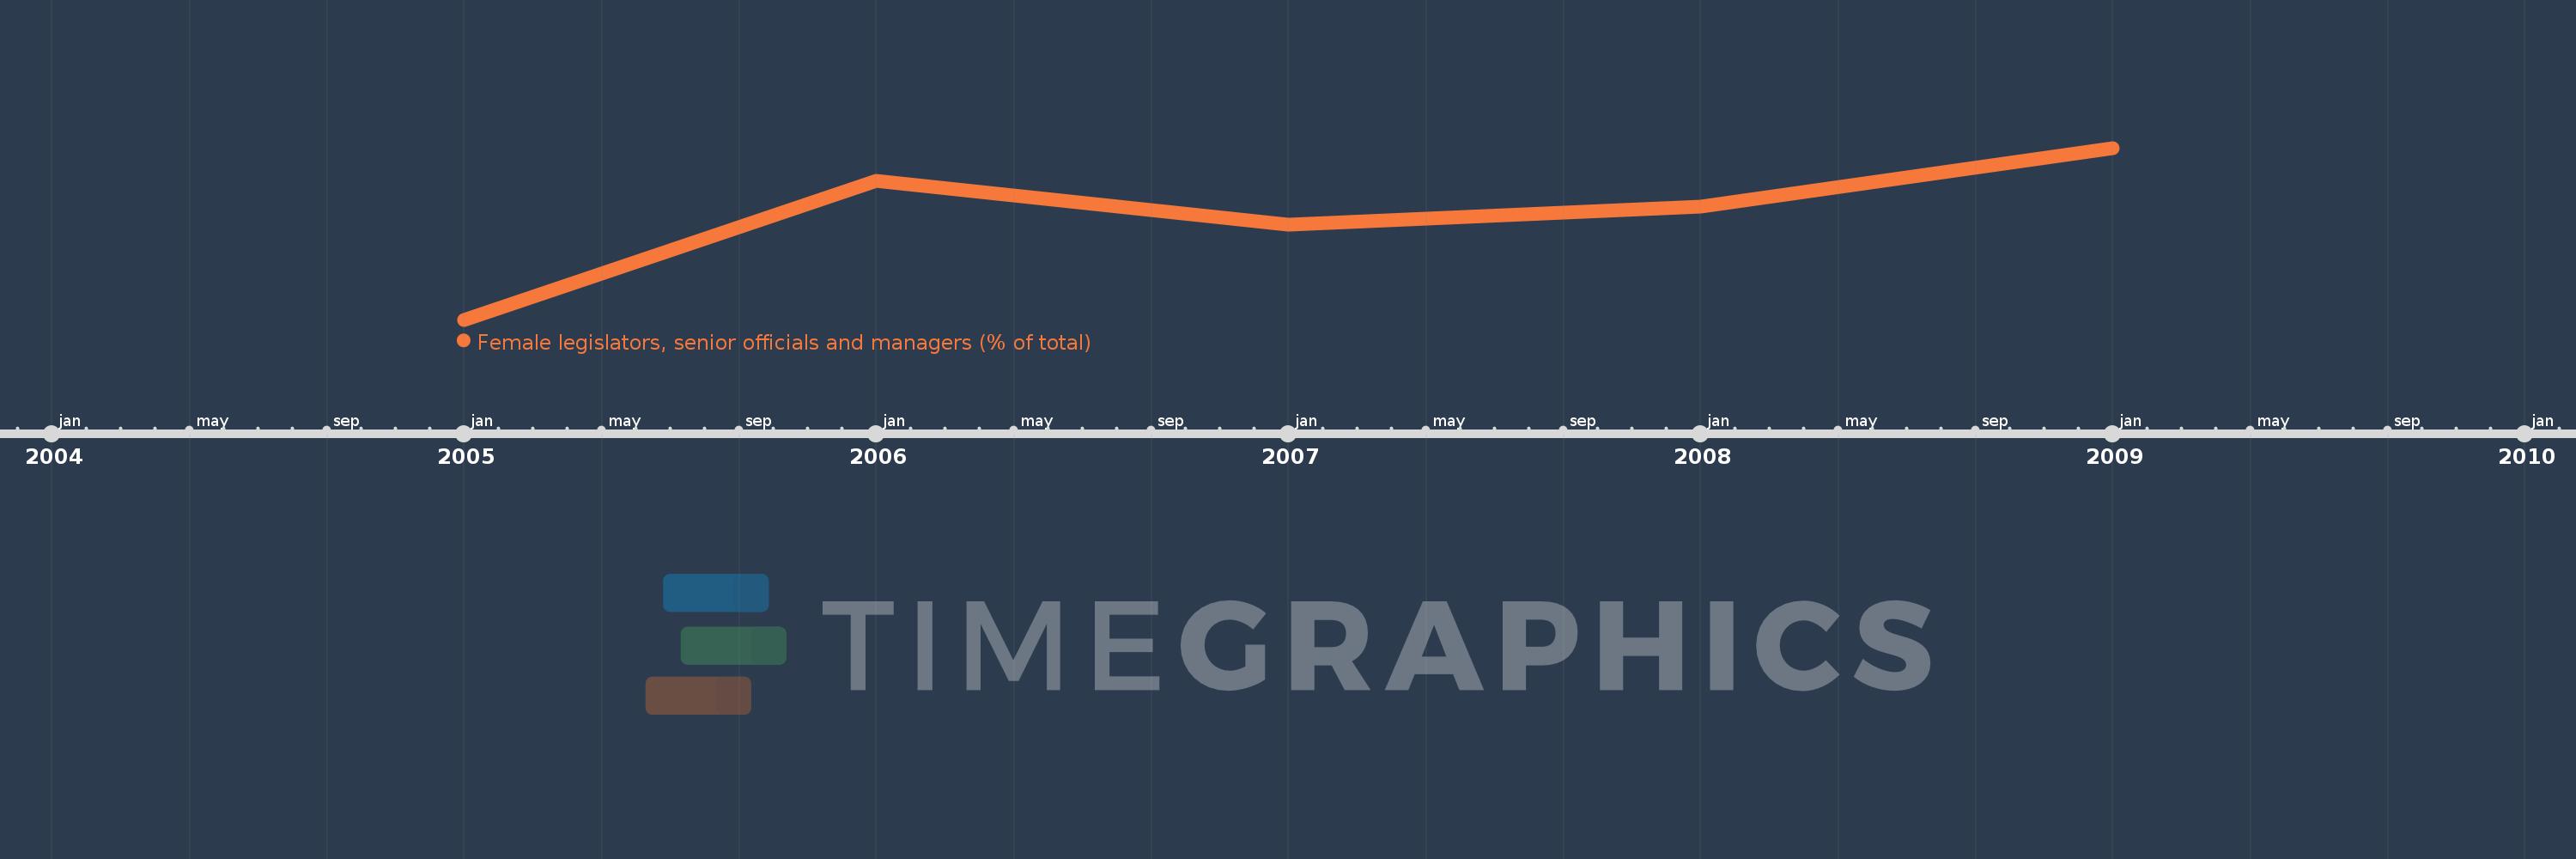
Female legislators, senior officials and managers (% of total)
2009,2008,2007,2006,2005
This statistics in other country:
Timeline:
This timeline shows a graph from 2005 to 2009 of Morocco. No data until 2004. Number of actual observations by date: 5.
Source name:
World Development Indicators
Source organization:
ILO Key Indicators of the Labour Market (KILM).
Categories, topics:
Public Sector, Gender
Last updated:
apr 23, 2017
Indicators value changes by year
Minimum:
10.756
jan 1, 2005
Maximum:
12.795
jan 1, 2009
At the date of observation
Value
Absolute change
Change from previous value
jan 1, 2005
10.756
+10.756
0.0%
jan 1, 2006
12.4
+1.644
15.28%
jan 1, 2007
11.886
-0.514
-4.14%
jan 1, 2008
12.099
+0.212
1.79%
jan 1, 2009
12.795
+0.696
5.75%
Ranking of countries by current statistics by years


Comments: