29
/
en
AIzaSyAYiBZKx7MnpbEhh9jyipgxe19OcubqV5w
April 1, 2024
73868
Austria
AUT
true
2
1
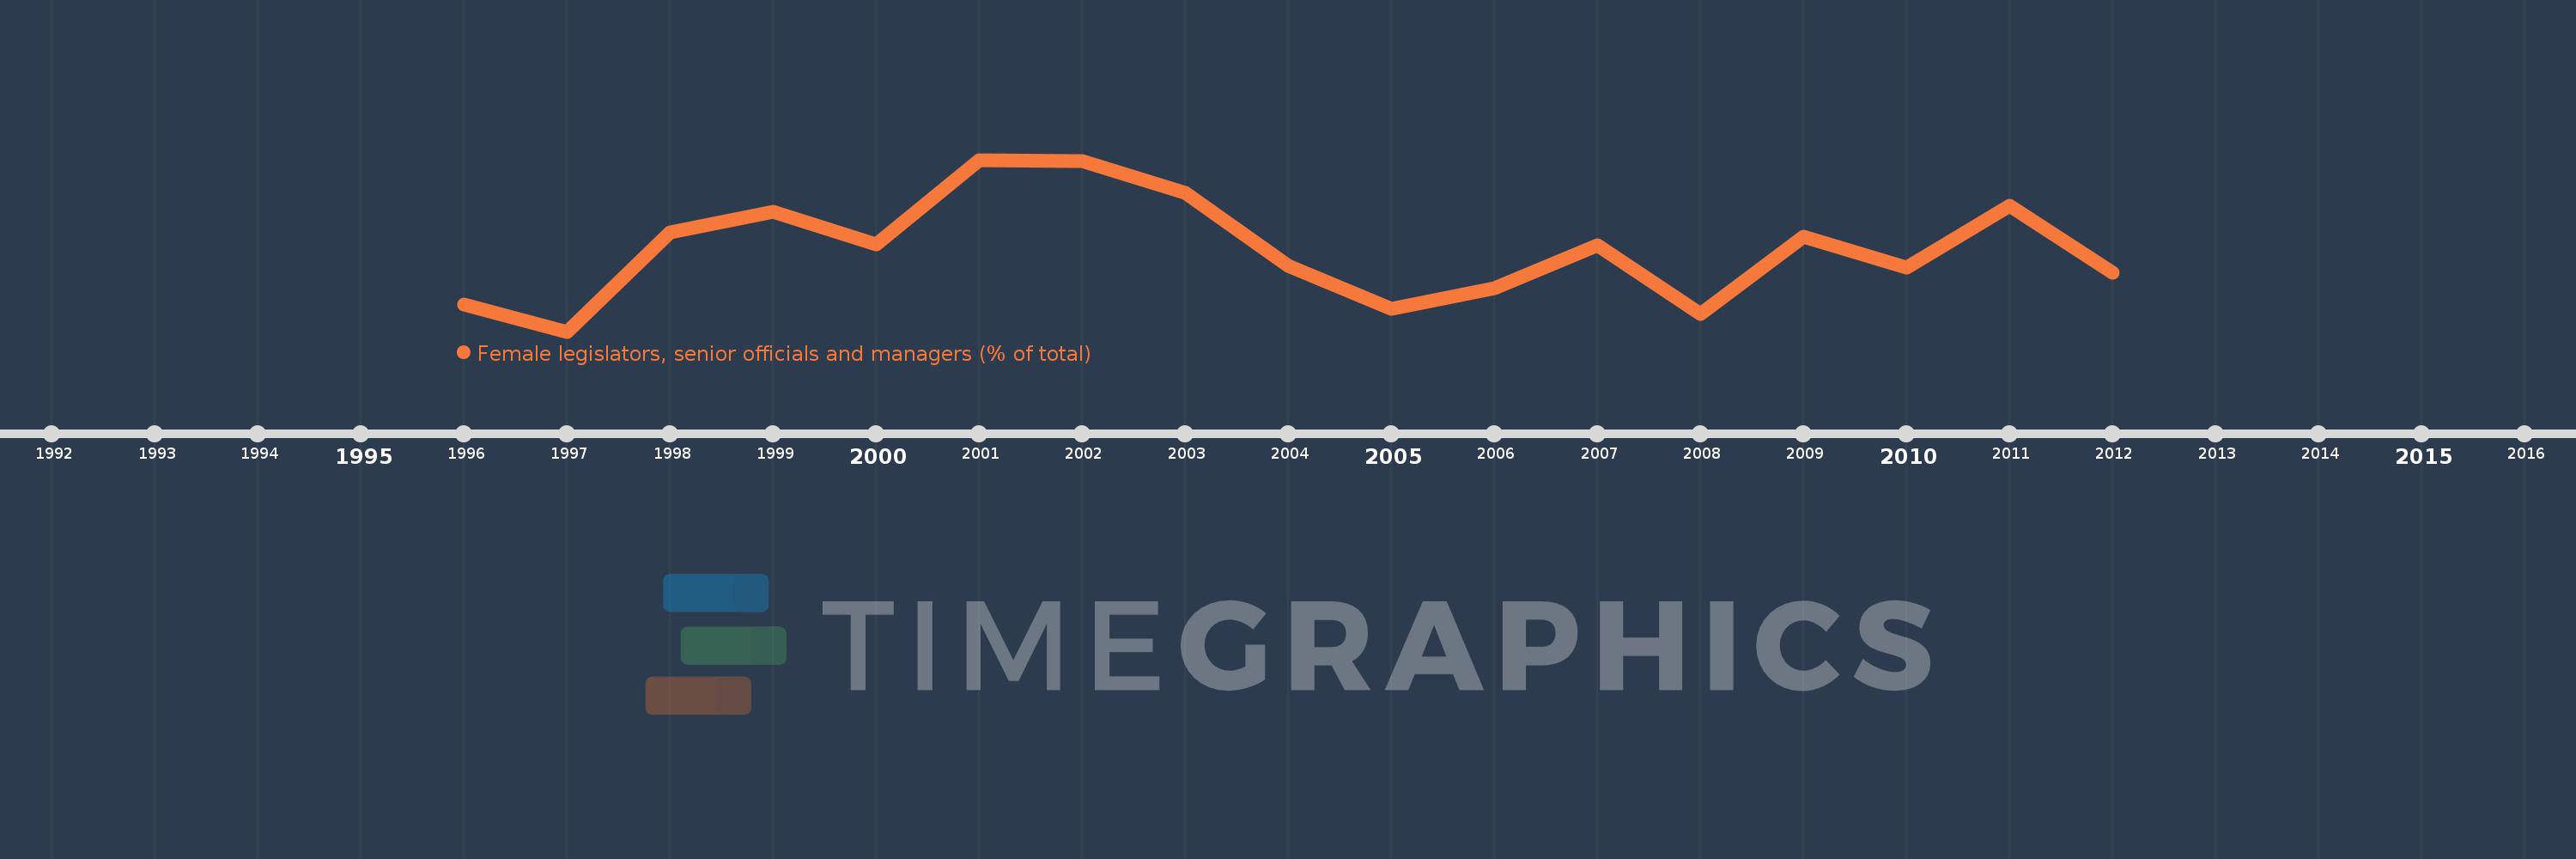
Female legislators, senior officials and managers (% of total)
2012,2011,2010,2009,2008,2007,2006,2005,2004,2003,2002,2001,2000,1999,1998,1997,1996
This statistics in other country:
Timeline:
This timeline shows a graph from 1996 to 2012 of Austria. No data until 1995. Number of actual observations by date: 17.
Source name:
World Development Indicators
Source organization:
ILO Key Indicators of the Labour Market (KILM).
Categories, topics:
Public Sector, Gender
Last updated:
apr 23, 2017
Indicators value changes by year
Minimum:
25.711
jan 1, 1997
Maximum:
30.083
jan 1, 2001
At the date of observation
Value
Absolute change
Change from previous value
jan 1, 1996
26.409
+26.409
0.0%
jan 1, 1997
25.711
-0.697
-2.64%
jan 1, 1998
28.241
+2.53
9.84%
jan 1, 1999
28.764
+0.523
1.85%
jan 1, 2000
27.93
-0.834
-2.9%
jan 1, 2001
30.083
+2.153
7.71%
jan 1, 2002
30.051
-0.032
-0.11%
jan 1, 2003
29.249
-0.802
-2.67%
jan 1, 2004
27.376
-1.874
-6.41%
jan 1, 2005
26.295
-1.081
-3.95%
jan 1, 2006
26.82
+0.525
2.0%
jan 1, 2007
27.918
+1.098
4.09%
jan 1, 2008
26.16
-1.758
-6.3%
jan 1, 2009
28.123
+1.963
7.5%
jan 1, 2010
27.348
-0.774
-2.75%
jan 1, 2011
28.918
+1.57
5.74%
jan 1, 2012
27.203
-1.715
-5.93%
Ranking of countries by current statistics by years


Comments: