29
/
en
AIzaSyAYiBZKx7MnpbEhh9jyipgxe19OcubqV5w
April 1, 2024
118867
Denmark
DNK
true
2
1
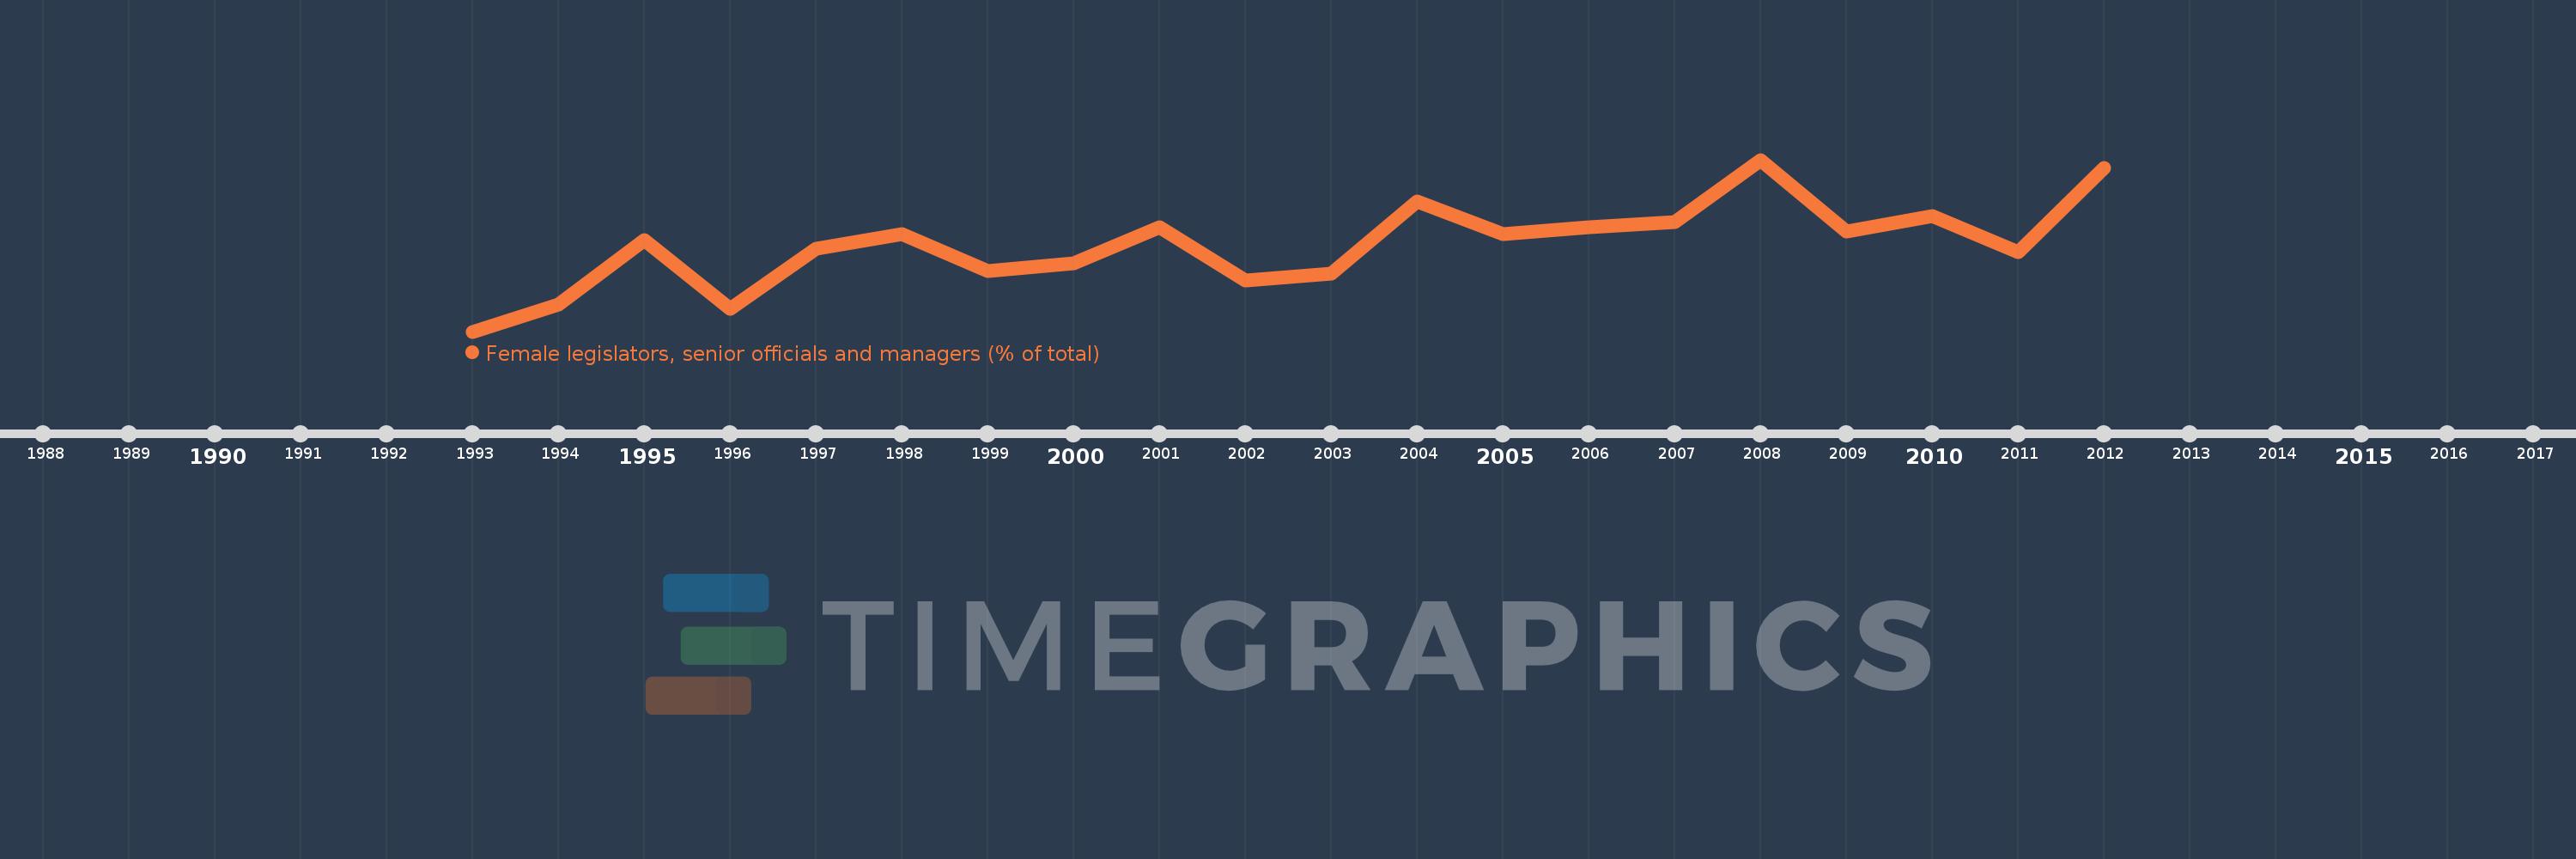
Female legislators, senior officials and managers (% of total)
2012,2011,2010,2009,2008,2007,2006,2005,2004,2003,2002,2001,2000,1999,1998,1997,1996,1995,1994,1993
This statistics in other country:
Timeline:
This timeline shows a graph from 1993 to 2012 of Denmark. No data until 1992. Number of actual observations by date: 20.
Source name:
World Development Indicators
Source organization:
ILO Key Indicators of the Labour Market (KILM).
Categories, topics:
Public Sector, Gender
Last updated:
apr 23, 2017
Indicators value changes by year
Minimum:
17.829
jan 1, 1993
Maximum:
28.302
jan 1, 2008
At the date of observation
Value
Absolute change
Change from previous value
jan 1, 1993
17.829
+17.829
0.0%
jan 1, 1994
19.457
+1.628
9.13%
jan 1, 1995
23.417
+3.96
20.35%
jan 1, 1996
19.228
-4.189
-17.89%
jan 1, 1997
22.865
+3.637
18.92%
jan 1, 1998
23.753
+0.888
3.88%
jan 1, 1999
21.507
-2.246
-9.46%
jan 1, 2000
22.013
+0.506
2.35%
jan 1, 2001
24.193
+2.18
9.9%
jan 1, 2002
20.968
-3.225
-13.33%
jan 1, 2003
21.368
+0.4
1.91%
jan 1, 2004
25.773
+4.405
20.61%
jan 1, 2005
23.759
-2.013
-7.81%
jan 1, 2006
24.188
+0.428
1.8%
jan 1, 2007
24.496
+0.309
1.28%
jan 1, 2008
28.302
+3.806
15.54%
jan 1, 2009
23.923
-4.379
-15.47%
jan 1, 2010
24.85
+0.927
3.87%
jan 1, 2011
22.686
-2.164
-8.71%
jan 1, 2012
27.8
+5.114
22.54%
Ranking of countries by current statistics by years


Comments: