29
/
en
AIzaSyAYiBZKx7MnpbEhh9jyipgxe19OcubqV5w
April 1, 2024
74949
Azerbaijan
AZE
true
2
1
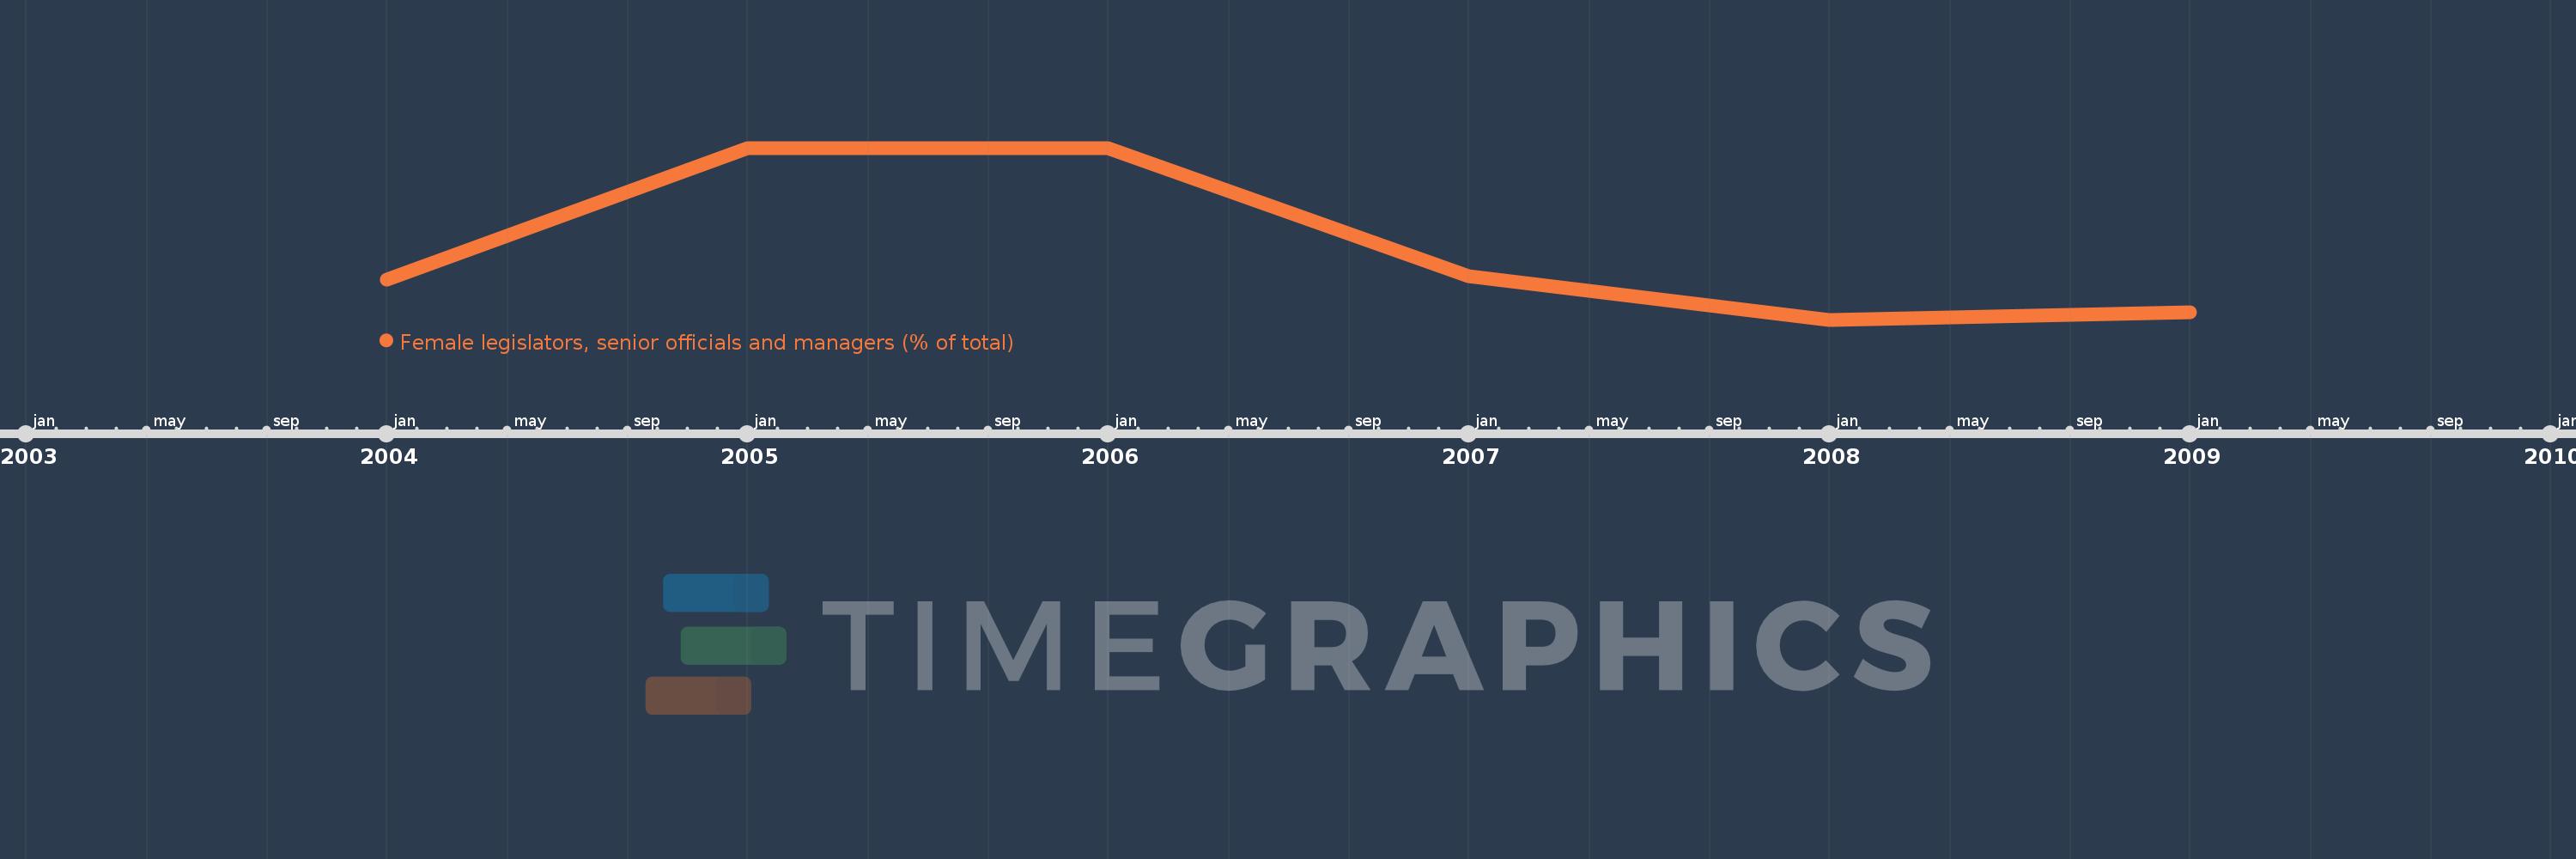
Female legislators, senior officials and managers (% of total)
2009,2008,2007,2006,2005,2004
This statistics in other country:
Timeline:
This timeline shows a graph from 2004 to 2009 of Azerbaijan. No data until 2003. Number of actual observations by date: 6.
Source name:
World Development Indicators
Source organization:
ILO Key Indicators of the Labour Market (KILM).
Categories, topics:
Public Sector, Gender
Last updated:
apr 23, 2017
Indicators value changes by year
Maximum:
47.659
jan 1, 2006
At the date of observation
Value
Absolute change
Change from previous value
jan 1, 2004
15.127
+15.127
0.0%
jan 1, 2005
47.531
+32.404
214.21%
jan 1, 2006
47.659
+0.128
0.27%
jan 1, 2007
15.876
-31.783
-66.69%
jan 1, 2008
5.192
-10.684
-67.29%
jan 1, 2009
7.128
+1.936
37.28%
Ranking of countries by current statistics by years


Comments: