29
/
en
AIzaSyAYiBZKx7MnpbEhh9jyipgxe19OcubqV5w
April 1, 2024
206702
Nepal
NPL
true
2
1
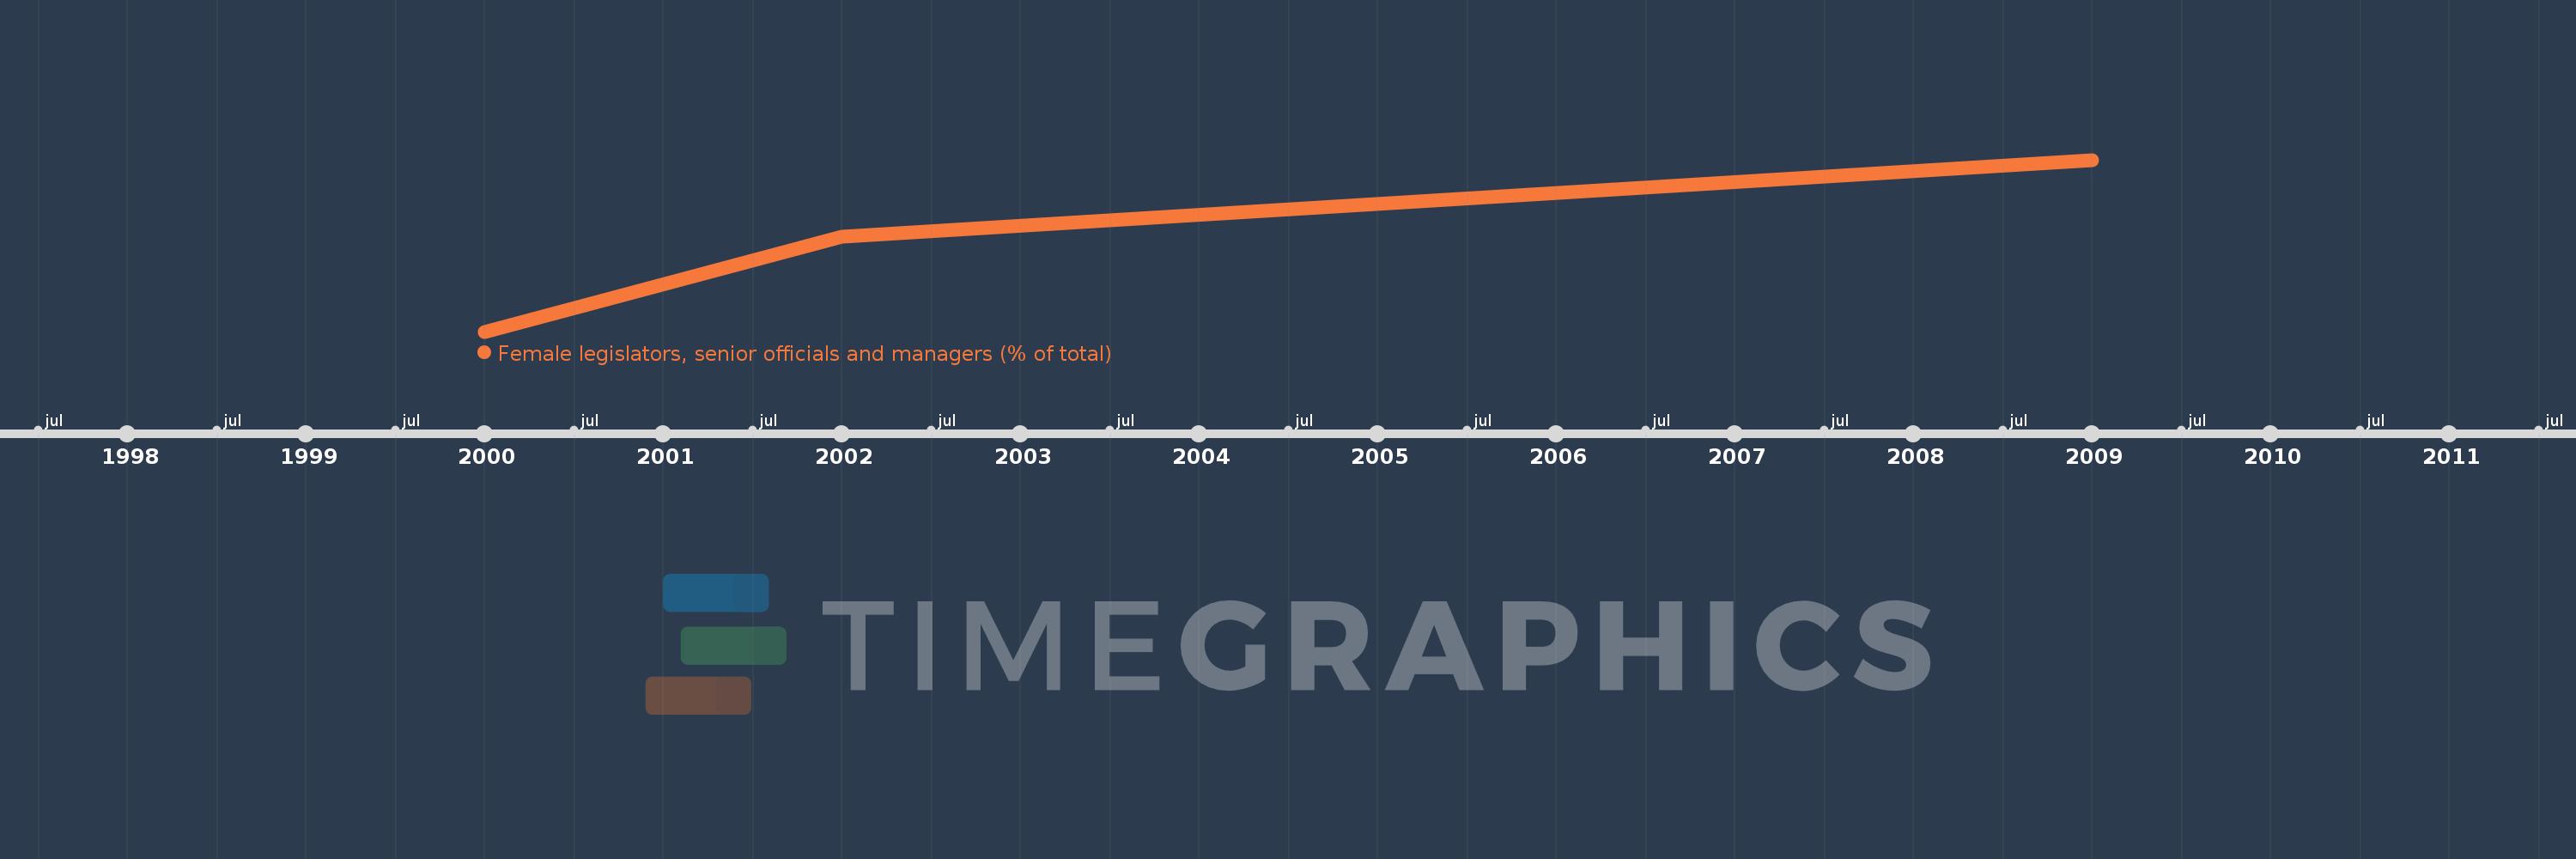
Female legislators, senior officials and managers (% of total)
2009,2002,2000
This statistics in other country:
Timeline:
This timeline shows a graph from 2000 to 2009 of Nepal. No data until 1999. Number of actual observations by date: 3.
Source name:
World Development Indicators
Source organization:
ILO Key Indicators of the Labour Market (KILM).
Categories, topics:
Public Sector, Gender
Last updated:
apr 23, 2017
Indicators value changes by year
At the date of observation
Value
Absolute change
Change from previous value
jan 1, 2000
8.333
+8.333
0.0%
jan 1, 2002
13.836
+5.502
66.03%
jan 1, 2009
18.31
+4.474
32.34%
Ranking of countries by current statistics by years


Comments: