29
/
en
AIzaSyAYiBZKx7MnpbEhh9jyipgxe19OcubqV5w
April 1, 2024
207896
Netherlands
NLD
true
2
1
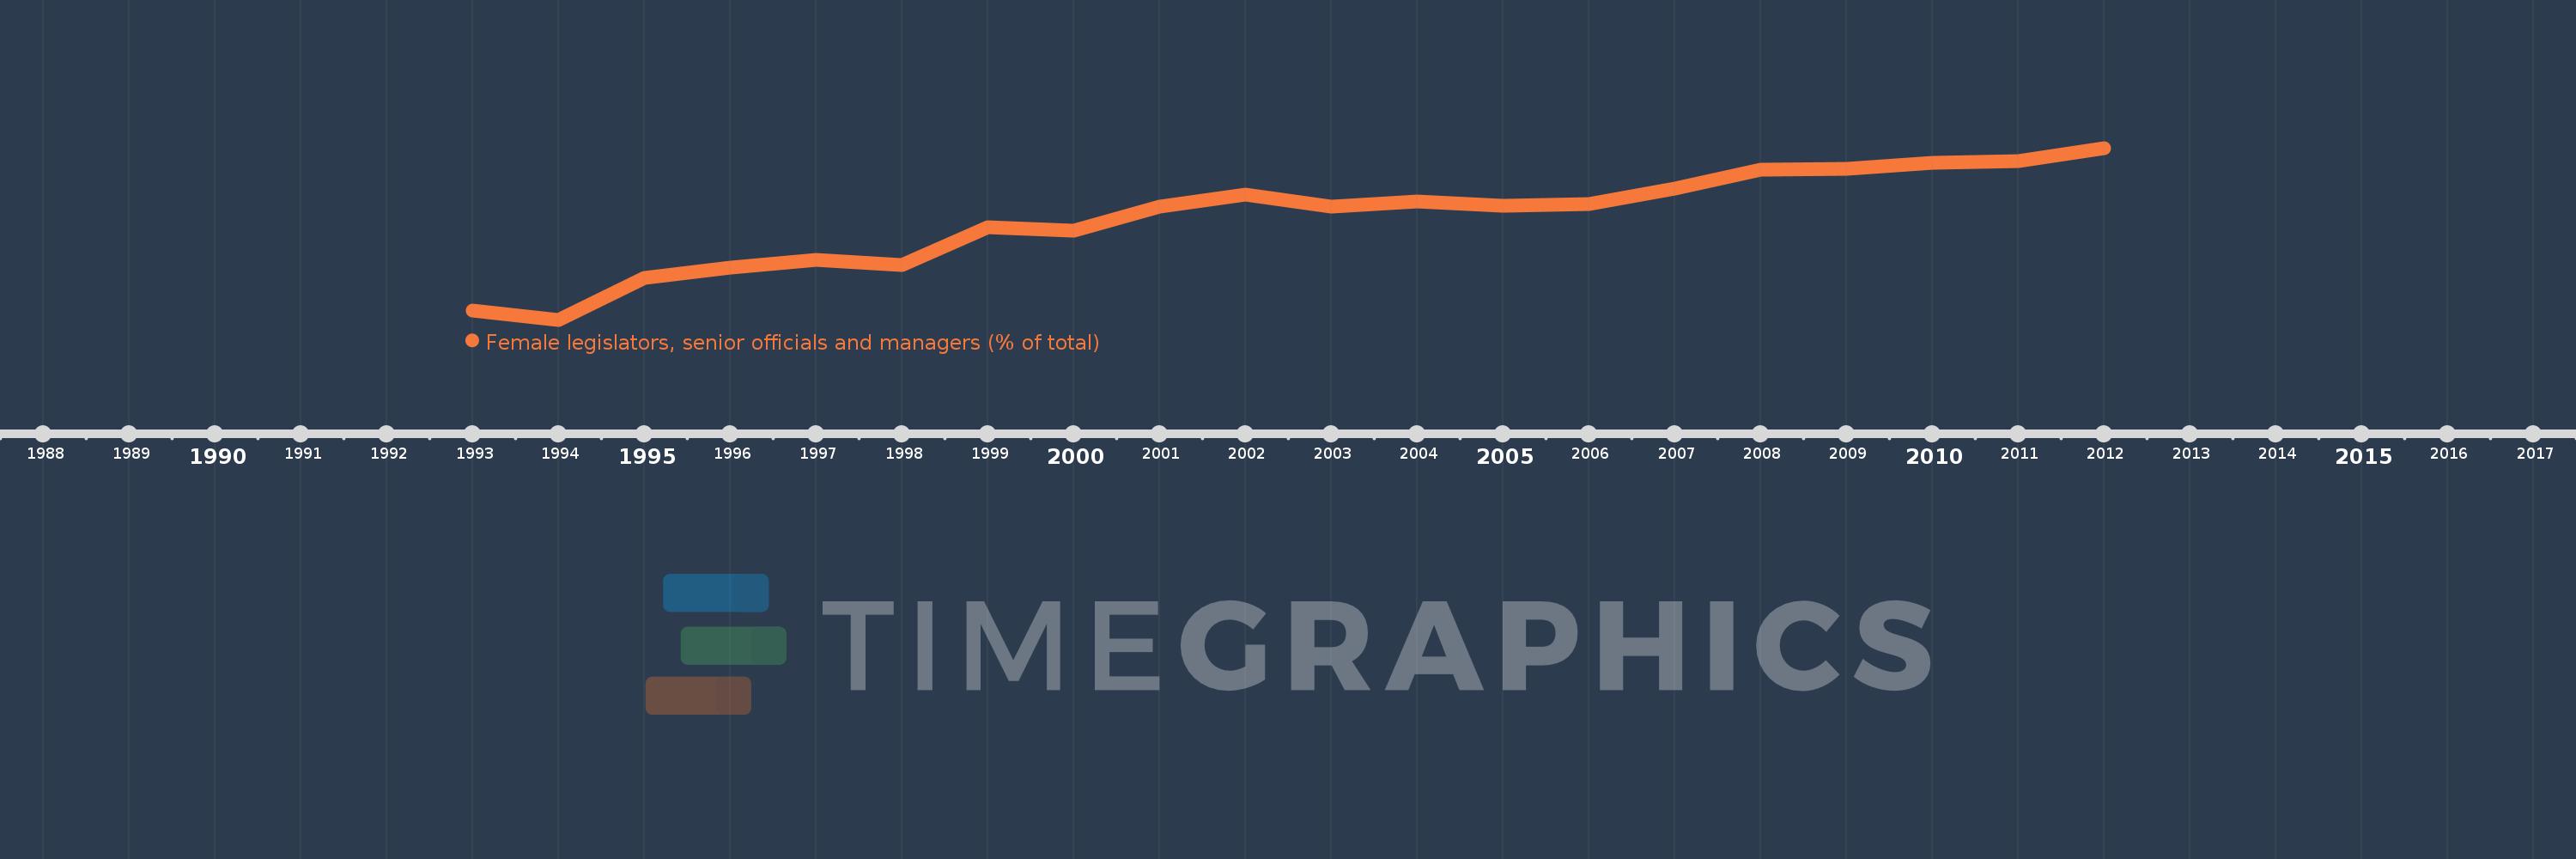
Female legislators, senior officials and managers (% of total)
2012,2011,2010,2009,2008,2007,2006,2005,2004,2003,2002,2001,2000,1999,1998,1997,1996,1995,1994,1993
This statistics in other country:
Timeline:
This timeline shows a graph from 1993 to 2012 of Netherlands. No data until 1992. Number of actual observations by date: 20.
Source name:
World Development Indicators
Source organization:
ILO Key Indicators of the Labour Market (KILM).
Categories, topics:
Public Sector, Gender
Last updated:
apr 23, 2017
Indicators value changes by year
Maximum:
29.582
jan 1, 2012
At the date of observation
Value
Absolute change
Change from previous value
jan 1, 1993
17.743
+17.743
0.0%
jan 1, 1994
17.1
-0.643
-3.62%
jan 1, 1995
20.152
+3.052
17.85%
jan 1, 1996
20.873
+0.721
3.58%
jan 1, 1997
21.455
+0.582
2.79%
jan 1, 1998
21.068
-0.387
-1.8%
jan 1, 1999
23.802
+2.734
12.98%
jan 1, 2000
23.599
-0.202
-0.85%
jan 1, 2001
25.33
+1.73
7.33%
jan 1, 2002
26.178
+0.849
3.35%
jan 1, 2003
25.349
-0.829
-3.17%
jan 1, 2004
25.669
+0.32
1.26%
jan 1, 2005
25.4
-0.269
-1.05%
jan 1, 2006
25.533
+0.133
0.52%
jan 1, 2007
26.661
+1.128
4.42%
jan 1, 2008
27.99
+1.329
4.98%
jan 1, 2009
28.079
+0.088
0.32%
jan 1, 2010
28.485
+0.406
1.45%
jan 1, 2011
28.604
+0.119
0.42%
jan 1, 2012
29.582
+0.978
3.42%
Ranking of countries by current statistics by years


Comments: