29
/
en
AIzaSyAYiBZKx7MnpbEhh9jyipgxe19OcubqV5w
April 1, 2024
225852
Portugal
PRT
true
2
1
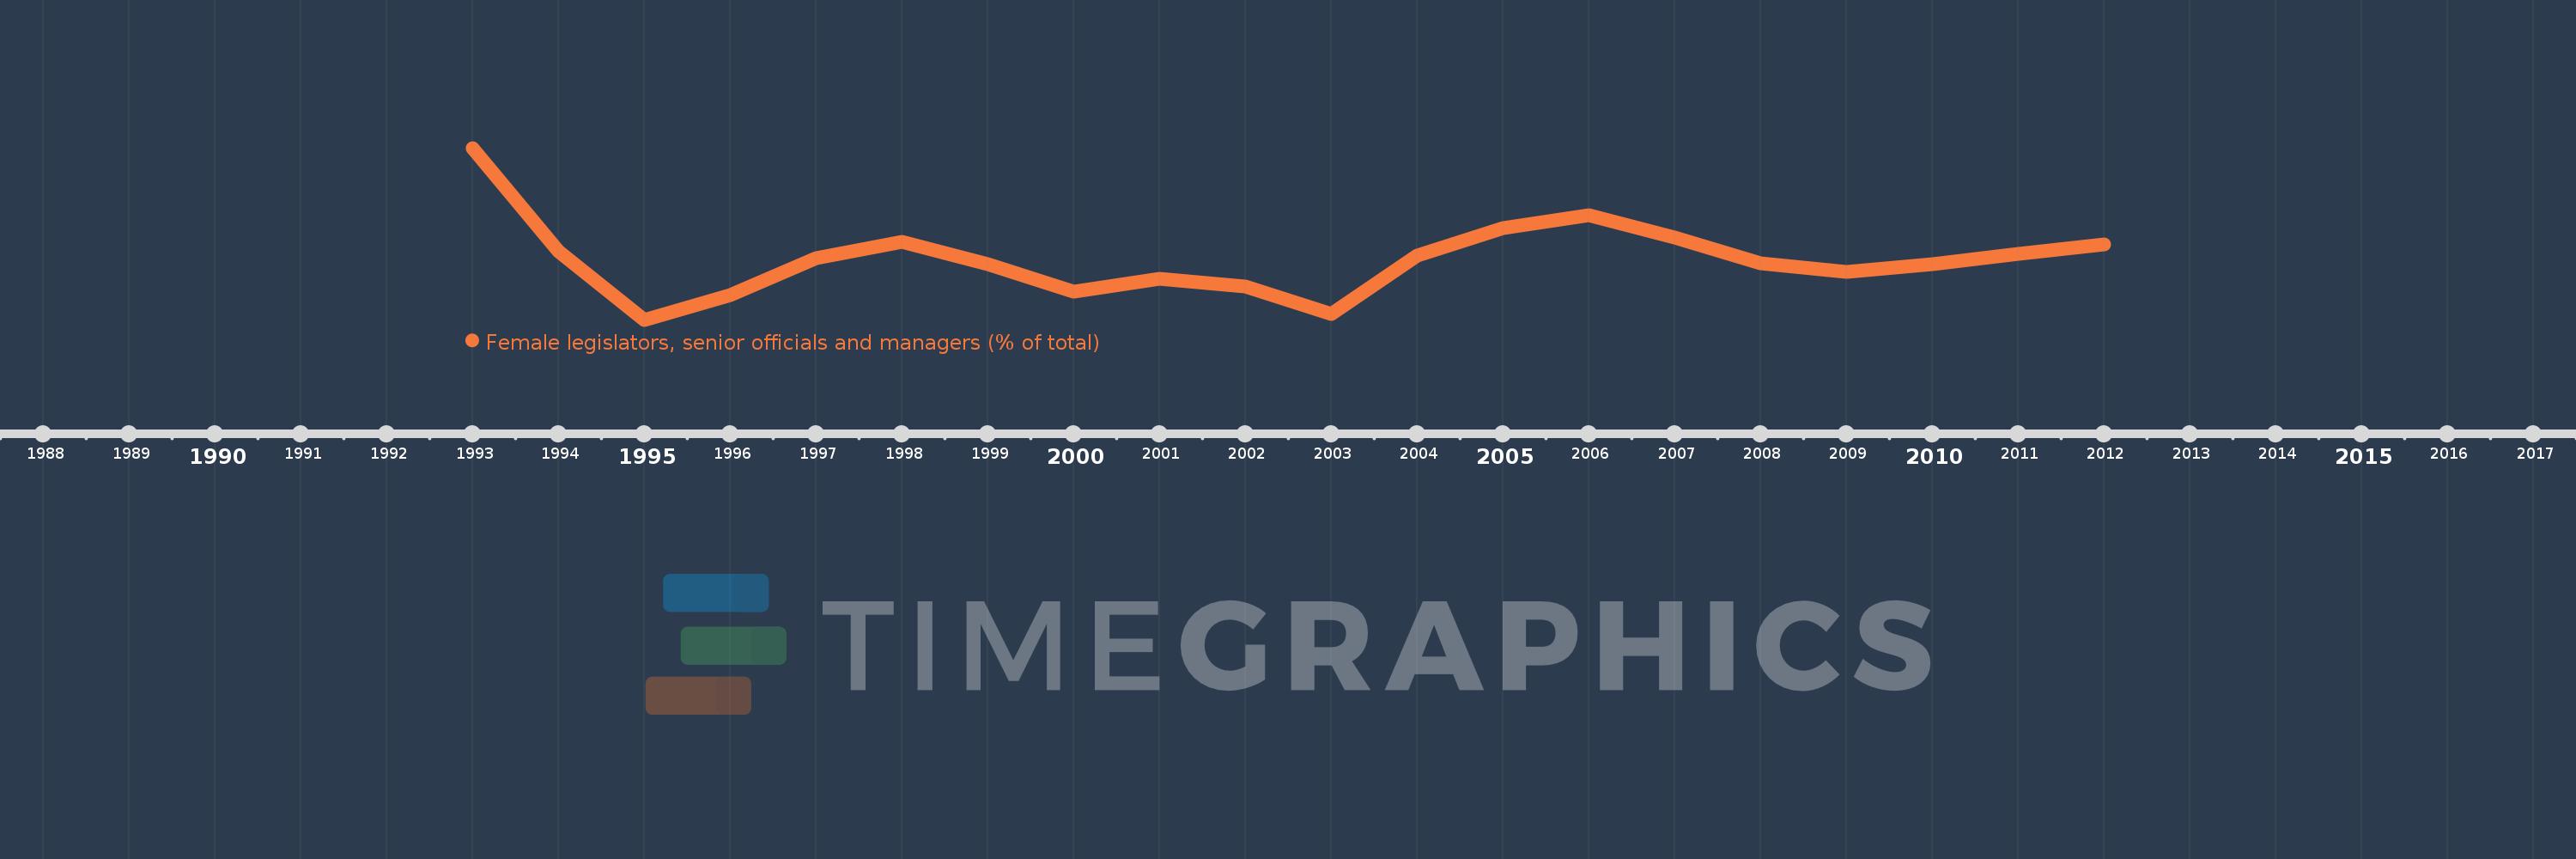
Female legislators, senior officials and managers (% of total)
2012,2011,2010,2009,2008,2007,2006,2005,2004,2003,2002,2001,2000,1999,1998,1997,1996,1995,1994,1993
This statistics in other country:
Timeline:
This timeline shows a graph from 1993 to 2012 of Portugal. No data until 1992. Number of actual observations by date: 20.
Source name:
World Development Indicators
Source organization:
ILO Key Indicators of the Labour Market (KILM).
Categories, topics:
Public Sector, Gender
Last updated:
apr 23, 2017
Indicators value changes by year
Minimum:
29.244
jan 1, 1995
At the date of observation
Value
Absolute change
Change from previous value
jan 1, 1993
37.14
+37.14
0.0%
jan 1, 1994
32.404
-4.736
-12.75%
jan 1, 1995
29.244
-3.161
-9.75%
jan 1, 1996
30.393
+1.15
3.93%
jan 1, 1997
32.071
+1.678
5.52%
jan 1, 1998
32.824
+0.753
2.35%
jan 1, 1999
31.784
-1.041
-3.17%
jan 1, 2000
30.538
-1.246
-3.92%
jan 1, 2001
31.108
+0.57
1.87%
jan 1, 2002
30.774
-0.335
-1.08%
jan 1, 2003
29.502
-1.272
-4.13%
jan 1, 2004
32.2
+2.698
9.14%
jan 1, 2005
33.457
+1.257
3.9%
jan 1, 2006
34.062
+0.605
1.81%
jan 1, 2007
33.032
-1.03
-3.03%
jan 1, 2008
31.834
-1.198
-3.63%
jan 1, 2009
31.453
-0.38
-1.2%
jan 1, 2010
31.784
+0.331
1.05%
jan 1, 2011
32.28
+0.496
1.56%
jan 1, 2012
32.688
+0.409
1.27%
Ranking of countries by current statistics by years


Comments: