29
/
en
AIzaSyAYiBZKx7MnpbEhh9jyipgxe19OcubqV5w
April 1, 2024
247497
Spain
ESP
true
2
1
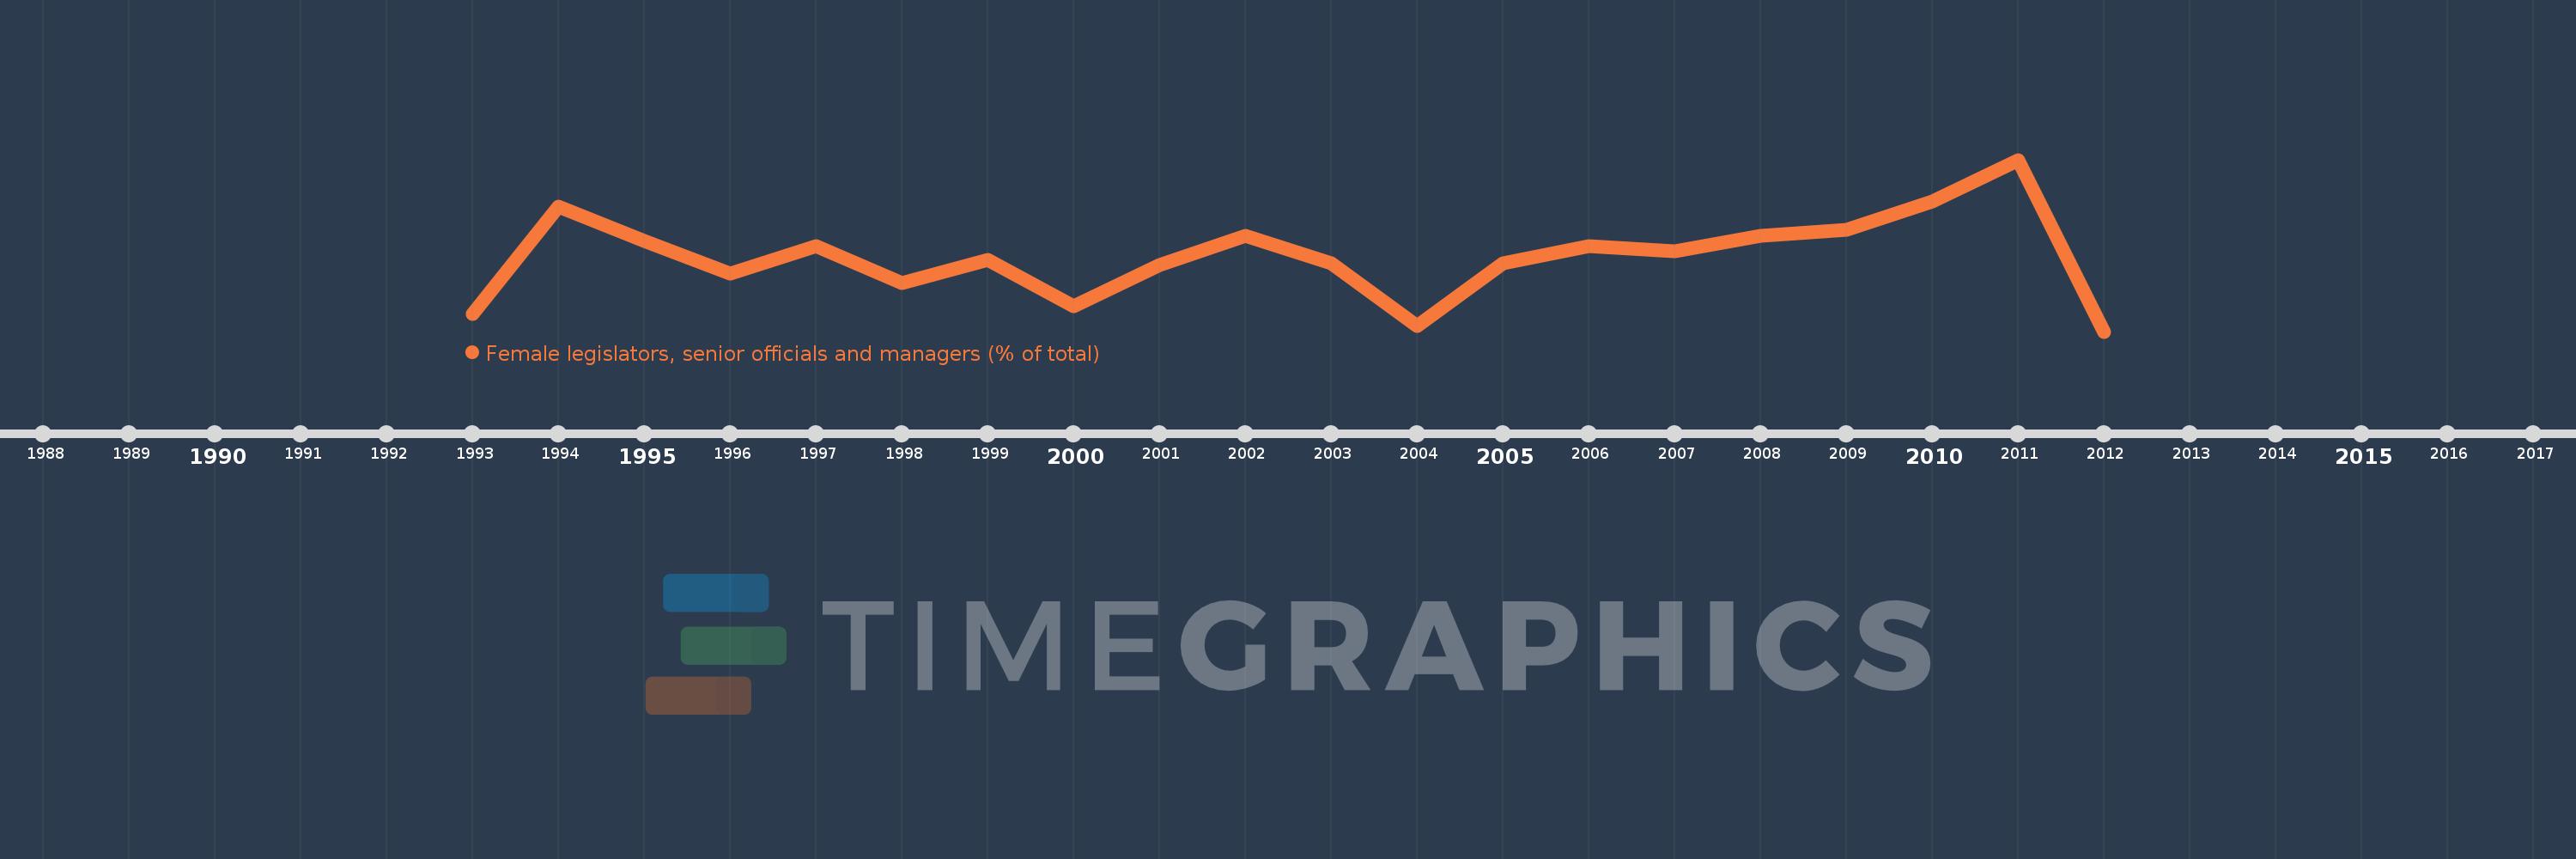
Female legislators, senior officials and managers (% of total)
2012,2011,2010,2009,2008,2007,2006,2005,2004,2003,2002,2001,2000,1999,1998,1997,1996,1995,1994,1993
This statistics in other country:
Timeline:
This timeline shows a graph from 1993 to 2012 of Spain. No data until 1992. Number of actual observations by date: 20.
Source name:
World Development Indicators
Source organization:
ILO Key Indicators of the Labour Market (KILM).
Categories, topics:
Public Sector, Gender
Last updated:
apr 23, 2017
Indicators value changes by year
Maximum:
34.333
jan 1, 2011
At the date of observation
Value
Absolute change
Change from previous value
jan 1, 1993
30.23
+30.23
0.0%
jan 1, 1994
33.076
+2.846
9.41%
jan 1, 1995
32.177
-0.899
-2.72%
jan 1, 1996
31.297
-0.88
-2.74%
jan 1, 1997
32.032
+0.734
2.35%
jan 1, 1998
31.063
-0.969
-3.02%
jan 1, 1999
31.663
+0.6
1.93%
jan 1, 2000
30.43
-1.233
-3.89%
jan 1, 2001
31.534
+1.104
3.63%
jan 1, 2002
32.308
+0.774
2.46%
jan 1, 2003
31.571
-0.737
-2.28%
jan 1, 2004
29.9
-1.671
-5.29%
jan 1, 2005
31.578
+1.678
5.61%
jan 1, 2006
32.039
+0.461
1.46%
jan 1, 2007
31.892
-0.147
-0.46%
jan 1, 2008
32.309
+0.417
1.31%
jan 1, 2009
32.46
+0.151
0.47%
jan 1, 2010
33.223
+0.764
2.35%
jan 1, 2011
34.333
+1.109
3.34%
jan 1, 2012
29.76
-4.573
-13.32%
Ranking of countries by current statistics by years


Comments: