29
/
en
AIzaSyAYiBZKx7MnpbEhh9jyipgxe19OcubqV5w
April 1, 2024
274727
United Arab Emirates
ARE
true
2
1
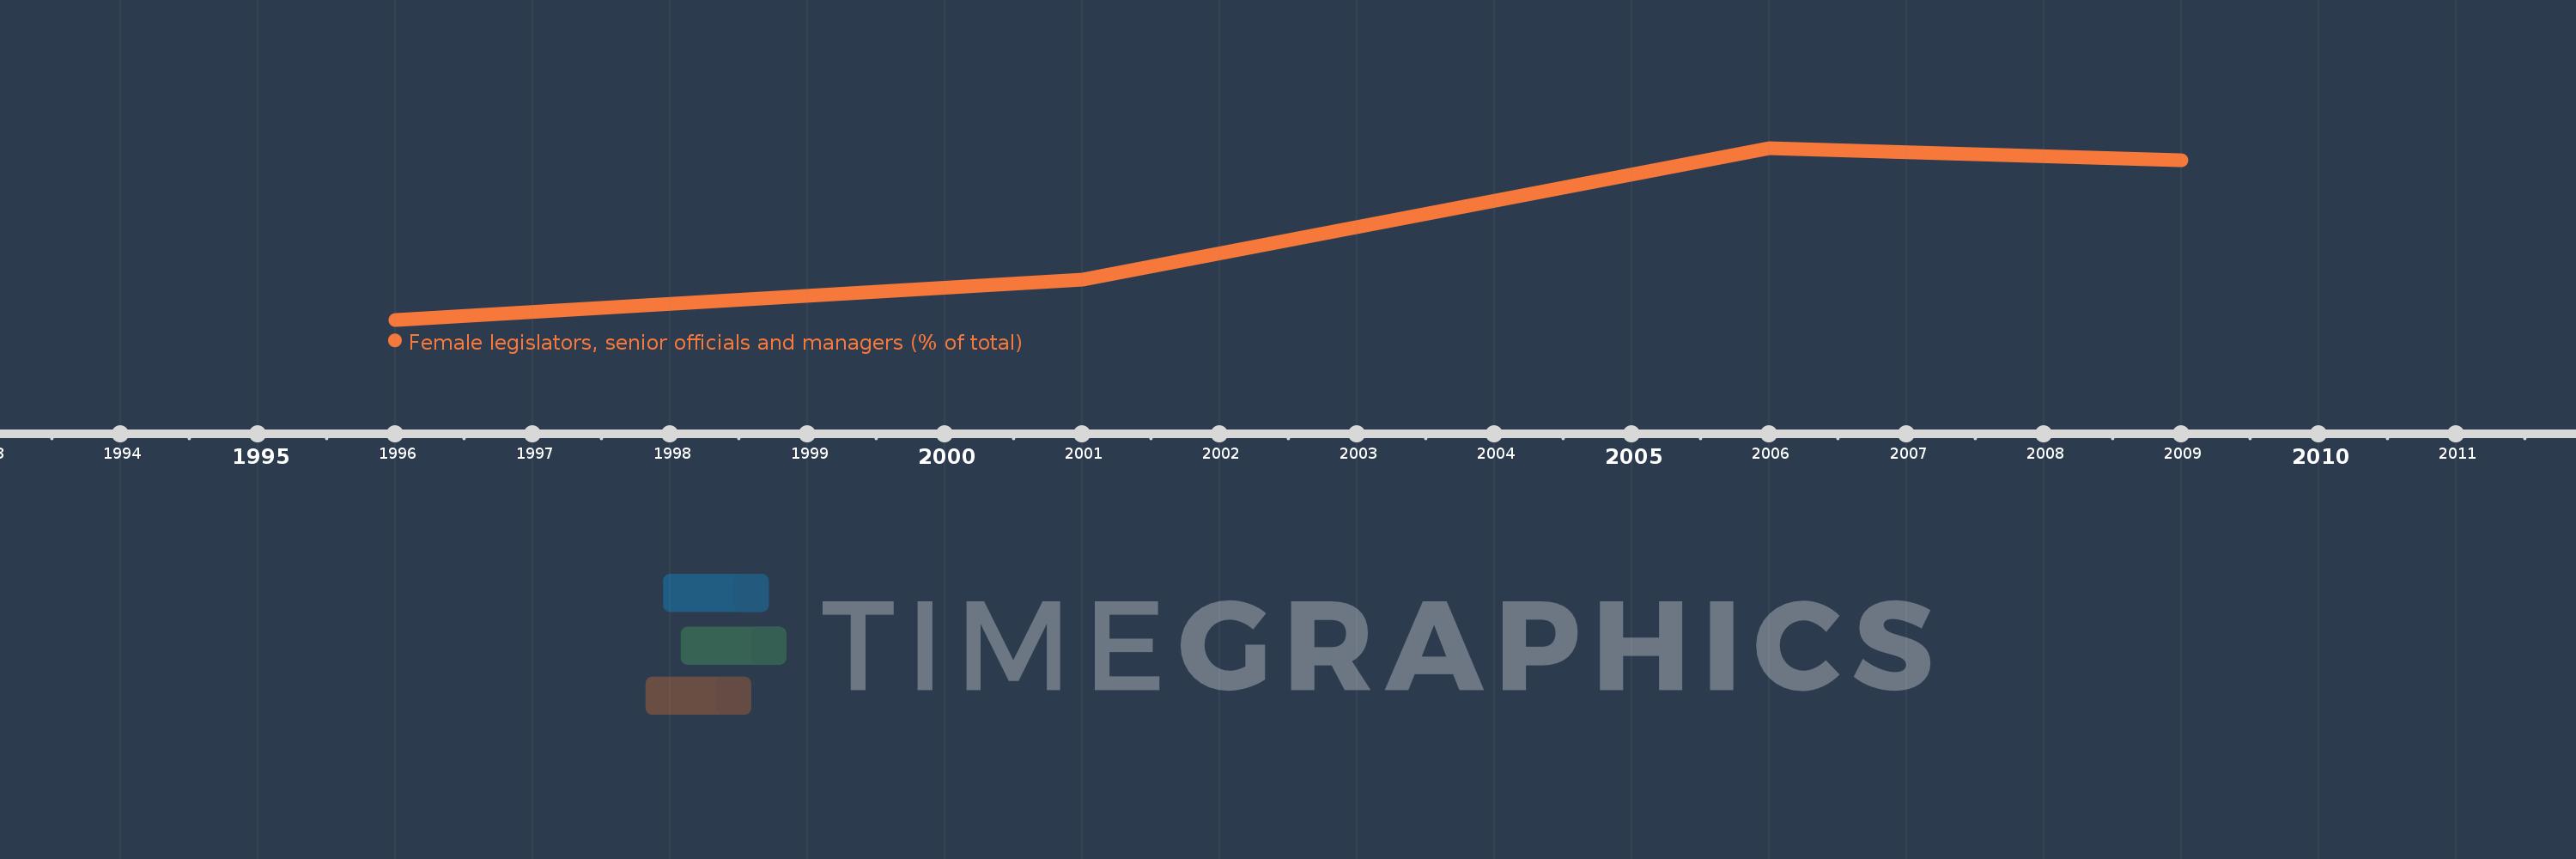
Female legislators, senior officials and managers (% of total)
2009,2006,2001,1996
This statistics in other country:
Timeline:
This timeline shows a graph from 1996 to 2009 of United Arab Emirates. No data until 1995. Number of actual observations by date: 4.
Source name:
World Development Indicators
Source organization:
ILO Key Indicators of the Labour Market (KILM).
Categories, topics:
Public Sector, Gender
Last updated:
apr 23, 2017
Indicators value changes by year
Maximum:
10.168
jan 1, 2006
At the date of observation
Value
Absolute change
Change from previous value
jan 1, 1996
7.091
+7.091
0.0%
jan 1, 2001
7.807
+0.715
10.09%
jan 1, 2006
10.168
+2.362
30.25%
jan 1, 2009
9.946
-0.223
-2.19%
Ranking of countries by current statistics by years


Comments: