29
/
en
AIzaSyAYiBZKx7MnpbEhh9jyipgxe19OcubqV5w
April 1, 2024
159920
Ireland
IRL
true
2
1
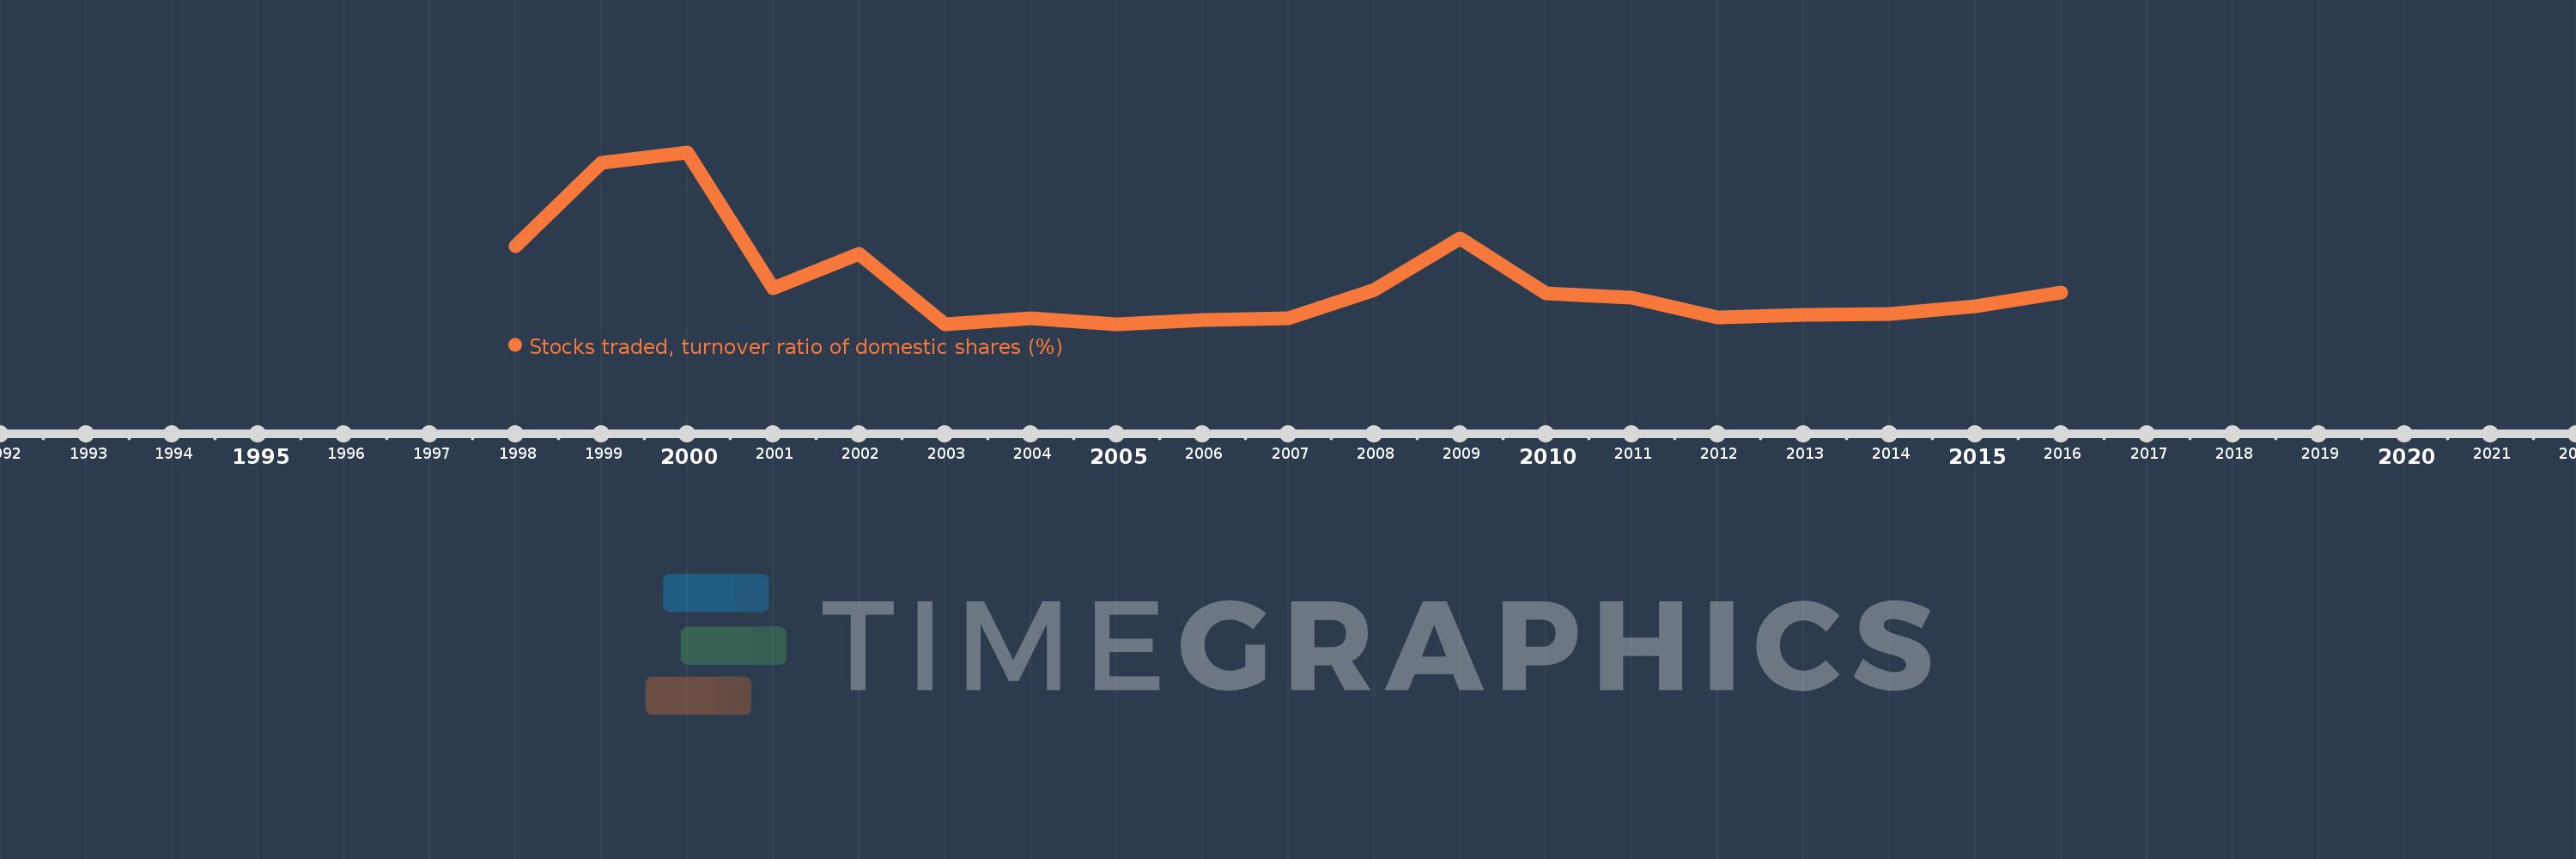
Stocks traded, turnover ratio of domestic shares (%)
2016,2015,2014,2013,2012,2011,2010,2009,2008,2007,2006,2005,2004,2003,2002,2001,2000,1999,1998
This statistics in other country:
Timeline:
This timeline shows a graph from 1998 to 2016 of Ireland. No data until 1997. Number of actual observations by date: 19.
Source name:
World Development Indicators
Source organization:
World Federation of Exchanges database.
Categories, topics:
Financial Sector
Last updated:
apr 23, 2017
Indicators value changes by year
At the date of observation
Value
Absolute change
Change from previous value
jan 1, 1998
32.725
+32.725
0.0%
jan 1, 1999
61.857
+29.132
89.02%
jan 1, 2000
65.55
+3.693
5.97%
jan 1, 2001
17.97
-47.58
-72.59%
jan 1, 2002
29.86
+11.891
66.17%
jan 1, 2003
5.238
-24.622
-82.46%
jan 1, 2004
7.175
+1.937
36.97%
jan 1, 2005
5.239
-1.936
-26.98%
jan 1, 2006
6.842
+1.603
30.6%
jan 1, 2007
7.399
+0.556
8.13%
jan 1, 2008
17.137
+9.738
131.62%
jan 1, 2009
35.487
+18.35
107.08%
jan 1, 2010
16.121
-19.366
-54.57%
jan 1, 2011
14.692
-1.429
-8.86%
jan 1, 2012
7.539
-7.154
-48.69%
jan 1, 2013
8.601
+1.062
14.09%
jan 1, 2014
8.759
+0.158
1.84%
jan 1, 2015
11.552
+2.793
31.89%
jan 1, 2016
16.35
+4.798
41.53%
Ranking of countries by current statistics by years


Comments: