29
/fr/
fr
AIzaSyAYiBZKx7MnpbEhh9jyipgxe19OcubqV5w
April 1, 2024
159920
Ireland
IRL
true
2
1
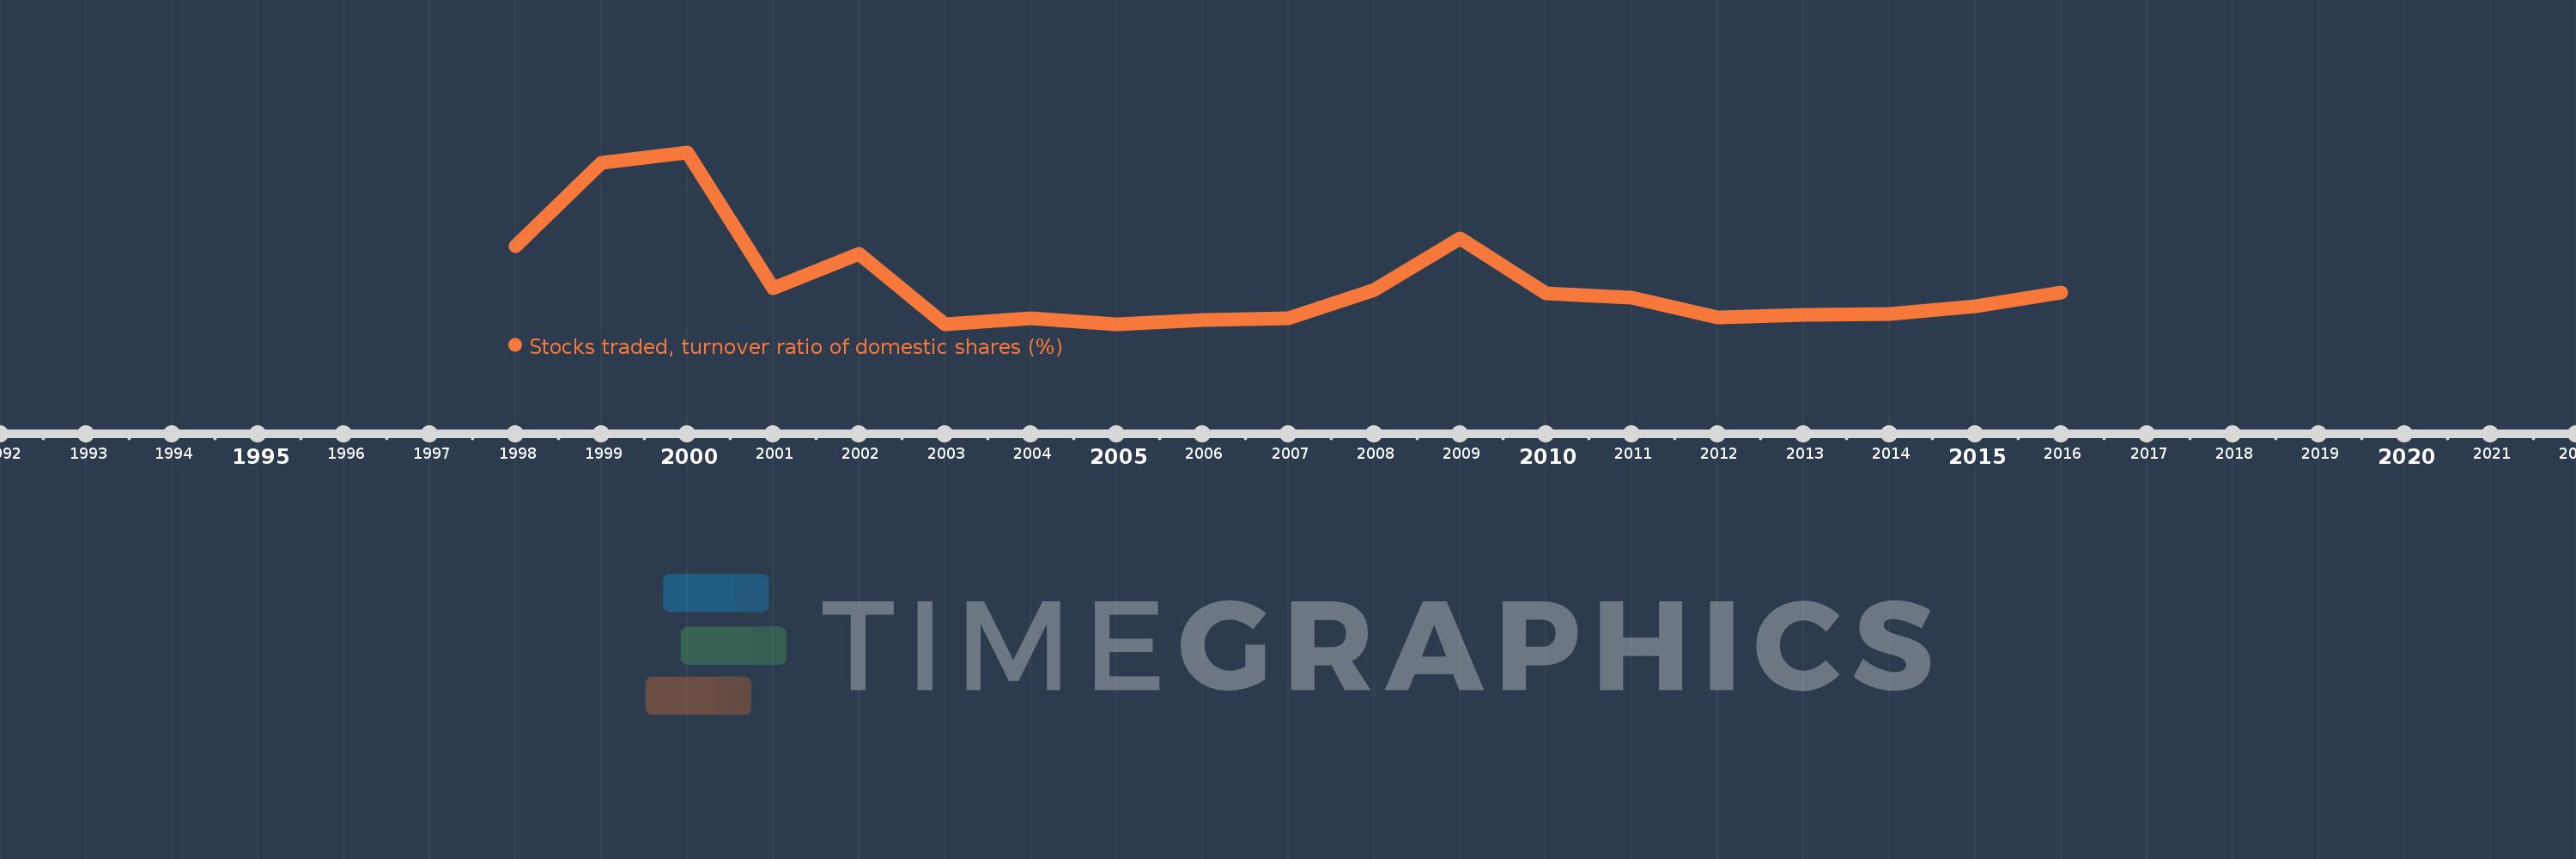
Stocks traded, turnover ratio of domestic shares (%)
2016,2015,2014,2013,2012,2011,2010,2009,2008,2007,2006,2005,2004,2003,2002,2001,2000,1999,1998
Cette statistique dans les autres pays:
La ligne de temps
Cette échelle de temps montre un graphique de 1998 année à 2016 année Ireland. Les données jusqu'à 1997 année ne sont pas présentés. Quantité d'observations actuelles selon dates: 19.
Source (désignation):
Les indicateurs du développement mondiale
Source (organisation):
World Federation of Exchanges database.
Catégories:
Financial Sector
Dernière mise à jour
23 avr. 2017
Les indicateurs de changement de valeurs selon les années
Minimum:
5.238
1 janv. 2003
Maximum:
65.55
1 janv. 2000
Pour la date d''observation
Valeur
Changement absolu
Le changement par rapport à la valeur précédente
1 janv. 1998
32.725
+32.725
0.0%
1 janv. 1999
61.857
+29.132
89.02%
1 janv. 2000
65.55
+3.693
5.97%
1 janv. 2001
17.97
-47.58
-72.59%
1 janv. 2002
29.86
+11.891
66.17%
1 janv. 2003
5.238
-24.622
-82.46%
1 janv. 2004
7.175
+1.937
36.97%
1 janv. 2005
5.239
-1.936
-26.98%
1 janv. 2006
6.842
+1.603
30.6%
1 janv. 2007
7.399
+0.556
8.13%
1 janv. 2008
17.137
+9.738
131.62%
1 janv. 2009
35.487
+18.35
107.08%
1 janv. 2010
16.121
-19.366
-54.57%
1 janv. 2011
14.692
-1.429
-8.86%
1 janv. 2012
7.539
-7.154
-48.69%
1 janv. 2013
8.601
+1.062
14.09%
1 janv. 2014
8.759
+0.158
1.84%
1 janv. 2015
11.552
+2.793
31.89%
1 janv. 2016
16.35
+4.798
41.53%
Classement des pays selon les statistiques actuelles par années


Commentaires: