29
/fr/
fr
AIzaSyAYiBZKx7MnpbEhh9jyipgxe19OcubqV5w
April 1, 2024
114323
Cote d'Ivoire
CIV
true
2
1
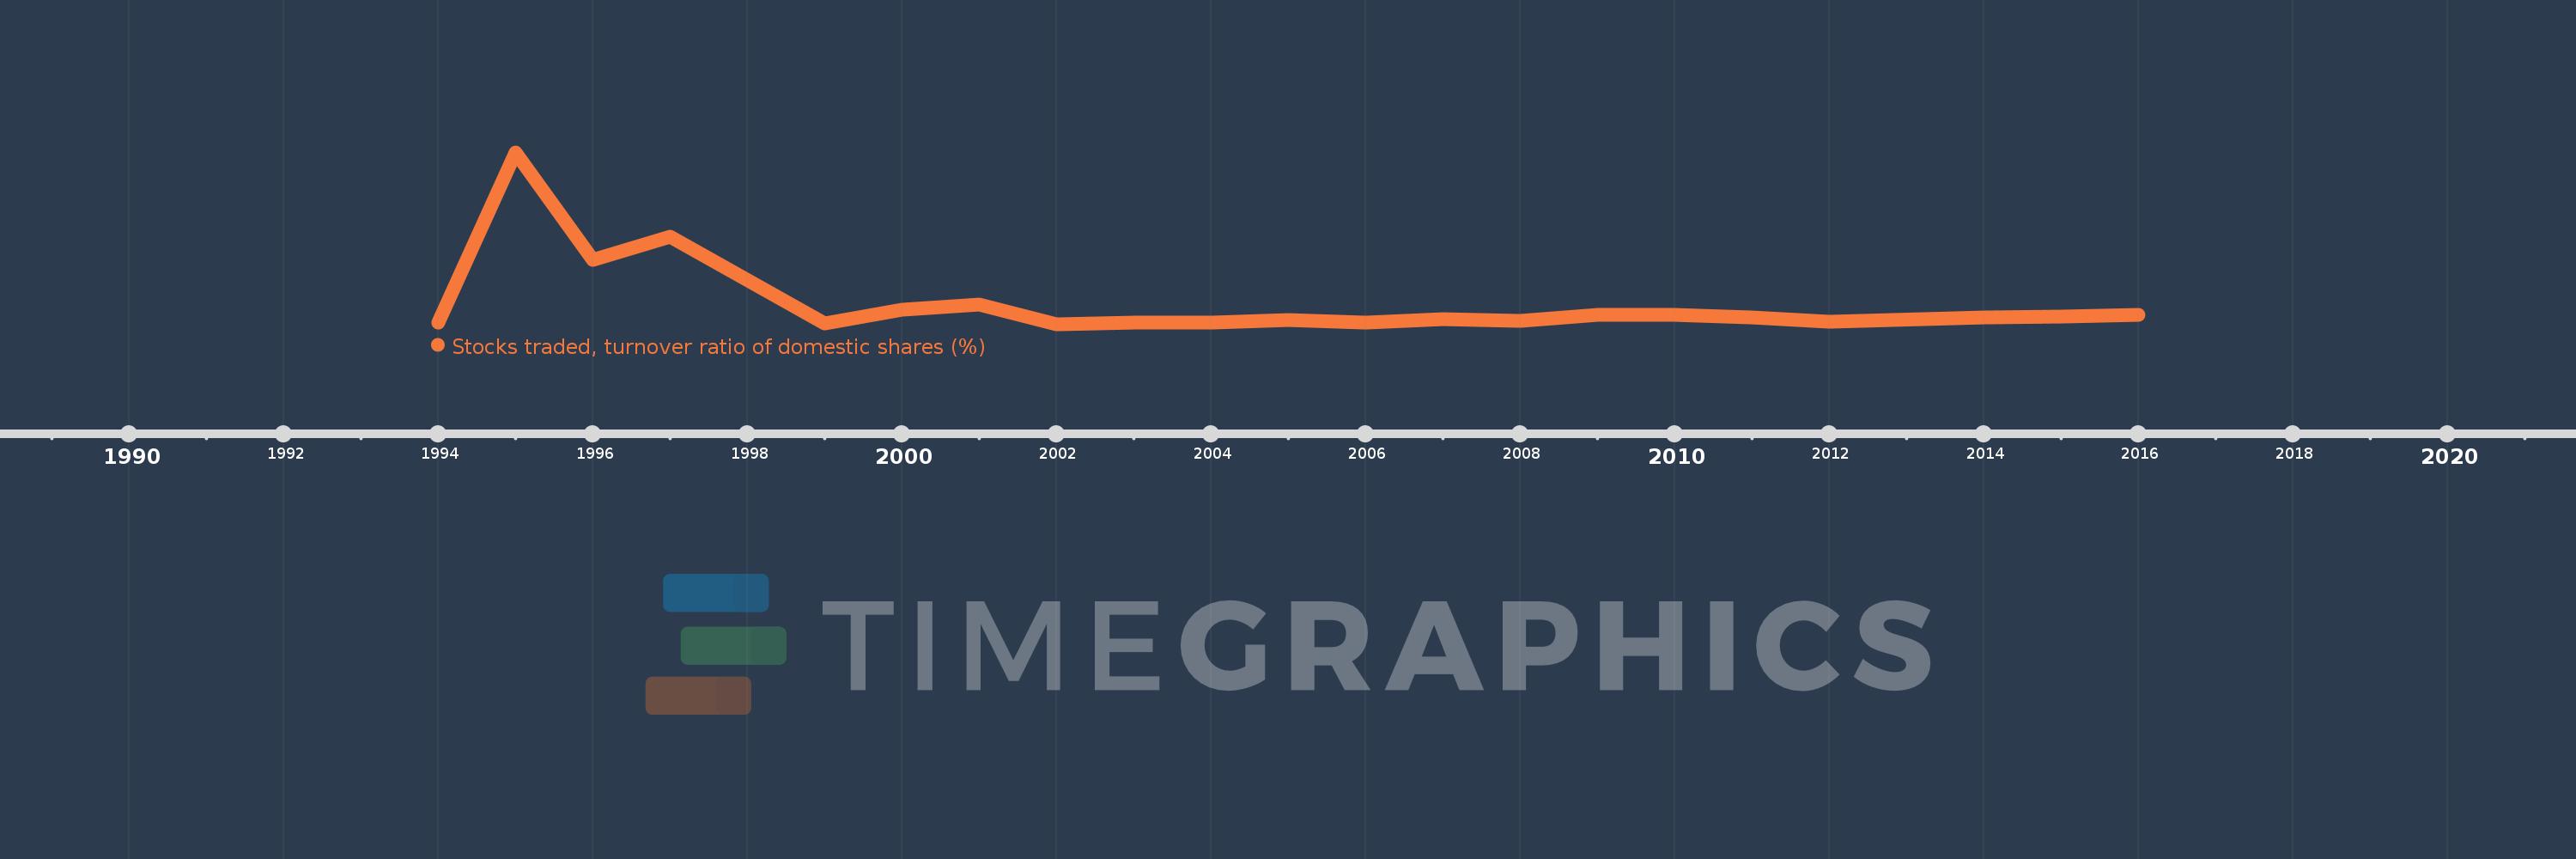
Stocks traded, turnover ratio of domestic shares (%)
2016,2015,2014,2012,2011,2010,2009,2008,2007,2006,2005,2004,2003,2002,2001,2000,1999,1997,1996,1995,1994
Cette statistique dans les autres pays:
La ligne de temps
Cette échelle de temps montre un graphique de 1994 année à 2016 année Cote d'Ivoire. Les données jusqu'à 1993 année ne sont pas présentés. Quantité d'observations actuelles selon dates: 21.
Source (désignation):
Les indicateurs du développement mondiale
Source (organisation):
World Federation of Exchanges database.
Catégories:
Financial Sector
Dernière mise à jour
23 avr. 2017
Les indicateurs de changement de valeurs selon les années
Minimum:
0.874
1 janv. 2002
Maximum:
58.884
1 janv. 1995
Pour la date d''observation
Valeur
Changement absolu
Le changement par rapport à la valeur précédente
1 janv. 1994
1.565
+1.565
0.0%
1 janv. 1995
58.884
+57.319
3.66 milles%
1 janv. 1996
22.564
-36.32
-61.68%
1 janv. 1997
30.552
+7.989
35.41%
1 janv. 1999
1.042
-29.51
-96.59%
1 janv. 2000
5.831
+4.789
459.58%
1 janv. 2001
7.561
+1.73
29.66%
1 janv. 2002
0.874
-6.687
-88.44%
1 janv. 2003
1.33
+0.457
52.25%
1 janv. 2004
1.473
+0.143
10.74%
1 janv. 2005
2.409
+0.936
63.51%
1 janv. 2006
1.499
-0.91
-37.78%
1 janv. 2007
2.576
+1.077
71.86%
1 janv. 2008
1.979
-0.597
-23.18%
1 janv. 2009
4.118
+2.139
108.07%
1 janv. 2010
3.929
-0.189
-4.59%
1 janv. 2011
3.171
-0.757
-19.27%
1 janv. 2012
1.854
-1.317
-41.54%
1 janv. 2014
3.108
+1.254
67.64%
1 janv. 2015
3.407
+0.299
9.61%
1 janv. 2016
4.177
+0.77
22.6%
Classement des pays selon les statistiques actuelles par années


Commentaires: