29
/fr/
fr
AIzaSyAYiBZKx7MnpbEhh9jyipgxe19OcubqV5w
April 1, 2024
208466
Netherlands
NLD
true
2
1
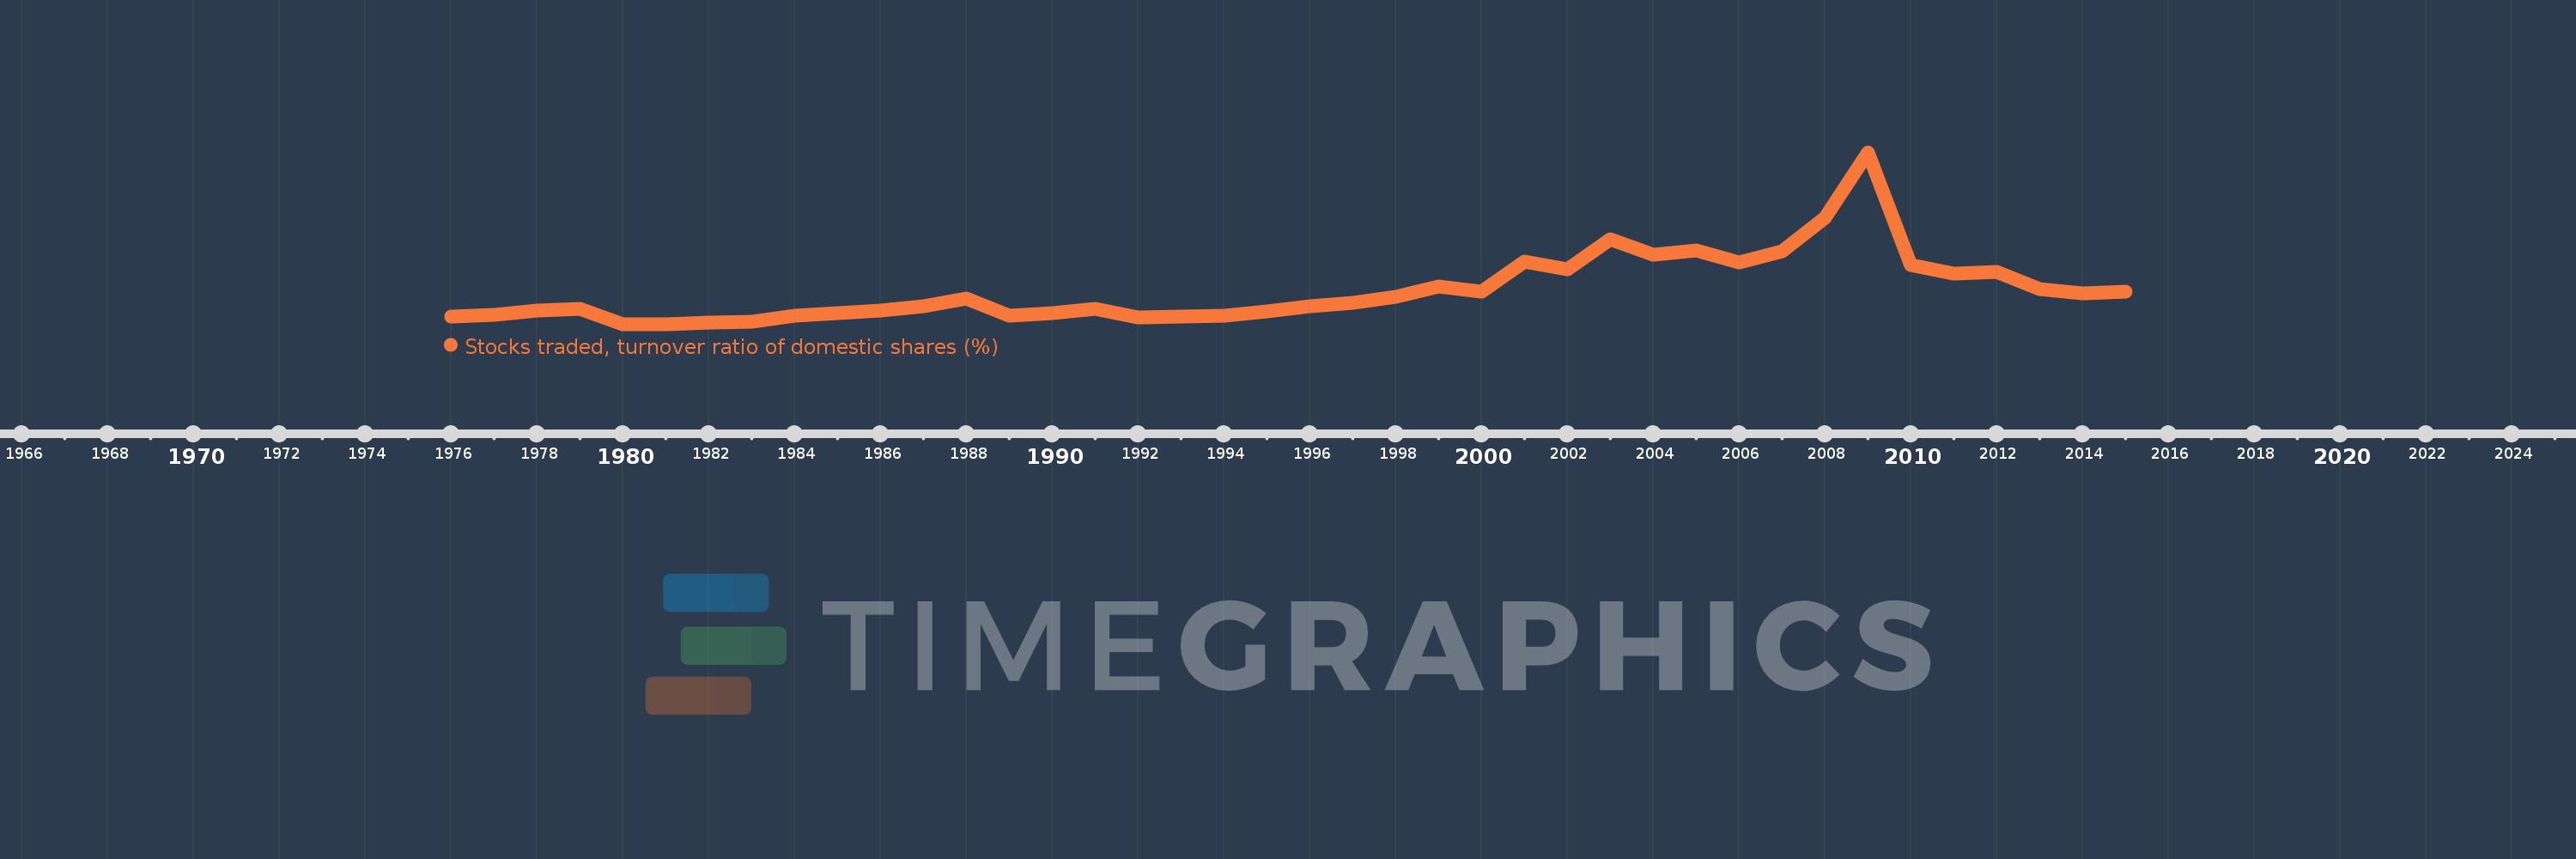
Stocks traded, turnover ratio of domestic shares (%)
2015,2014,2013,2012,2011,2010,2009,2008,2007,2006,2005,2004,2003,2002,2001,2000,1999,1998,1997,1996,1995,1994,1993,1992,1991,1990,1989,1988,1987,1986,1985,1984,1983,1982,1981,1980,1979,1978,1977,1976
Cette statistique dans les autres pays:
La ligne de temps
Cette échelle de temps montre un graphique de 1976 année à 2015 année Netherlands. Les données jusqu'à 1975 année ne sont pas présentés. Quantité d'observations actuelles selon dates: 40.
Source (désignation):
Les indicateurs du développement mondiale
Source (organisation):
World Federation of Exchanges database.
Catégories:
Financial Sector
Dernière mise à jour
23 avr. 2017
Les indicateurs de changement de valeurs selon les années
Minimum:
16.023
1 janv. 1980
Maximum:
249.733
1 janv. 2009
Pour la date d''observation
Valeur
Changement absolu
Le changement par rapport à la valeur précédente
1 janv. 1976
26.027
+26.027
0.0%
1 janv. 1977
29.069
+3.042
11.69%
1 janv. 1978
34.932
+5.862
20.17%
1 janv. 1979
37.489
+2.557
7.32%
1 janv. 1980
16.023
-21.465
-57.26%
1 janv. 1981
16.172
+0.149
0.93%
1 janv. 1982
18.403
+2.231
13.8%
1 janv. 1983
19.14
+0.737
4.01%
1 janv. 1984
28.104
+8.964
46.83%
1 janv. 1985
31.32
+3.216
11.44%
1 janv. 1986
34.039
+2.719
8.68%
1 janv. 1987
40.146
+6.107
17.94%
1 janv. 1988
51.138
+10.992
27.38%
1 janv. 1989
27.905
-23.233
-45.43%
1 janv. 1990
31.645
+3.74
13.4%
1 janv. 1991
36.468
+4.823
15.24%
1 janv. 1992
25.16
-11.308
-31.01%
1 janv. 1993
26.082
+0.921
3.66%
1 janv. 1994
28.122
+2.04
7.82%
1 janv. 1995
33.902
+5.78
20.55%
1 janv. 1996
40.396
+6.494
19.16%
1 janv. 1997
45.642
+5.246
12.99%
1 janv. 1998
52.99
+7.348
16.1%
1 janv. 1999
67.122
+14.131
26.67%
1 janv. 2000
60.501
-6.621
-9.86%
1 janv. 2001
101.55
+41.049
67.85%
1 janv. 2002
90.634
-10.916
-10.75%
1 janv. 2003
131.607
+40.973
45.21%
1 janv. 2004
110.287
-21.32
-16.2%
1 janv. 2005
116.678
+6.391
5.79%
1 janv. 2006
100.315
-16.363
-14.02%
1 janv. 2007
115.553
+15.238
15.19%
1 janv. 2008
161.214
+45.662
39.52%
1 janv. 2009
249.733
+88.518
54.91%
1 janv. 2010
96.939
-152.794
-61.18%
1 janv. 2011
84.313
-12.626
-13.02%
1 janv. 2012
87.02
+2.707
3.21%
1 janv. 2013
64.145
-22.875
-26.29%
1 janv. 2014
58.275
-5.87
-9.15%
1 janv. 2015
60.538
+2.264
3.88%
Classement des pays selon les statistiques actuelles par années


Commentaires: