29
/fr/
fr
AIzaSyAYiBZKx7MnpbEhh9jyipgxe19OcubqV5w
April 1, 2024
94282
Bulgaria
BGR
true
2
1
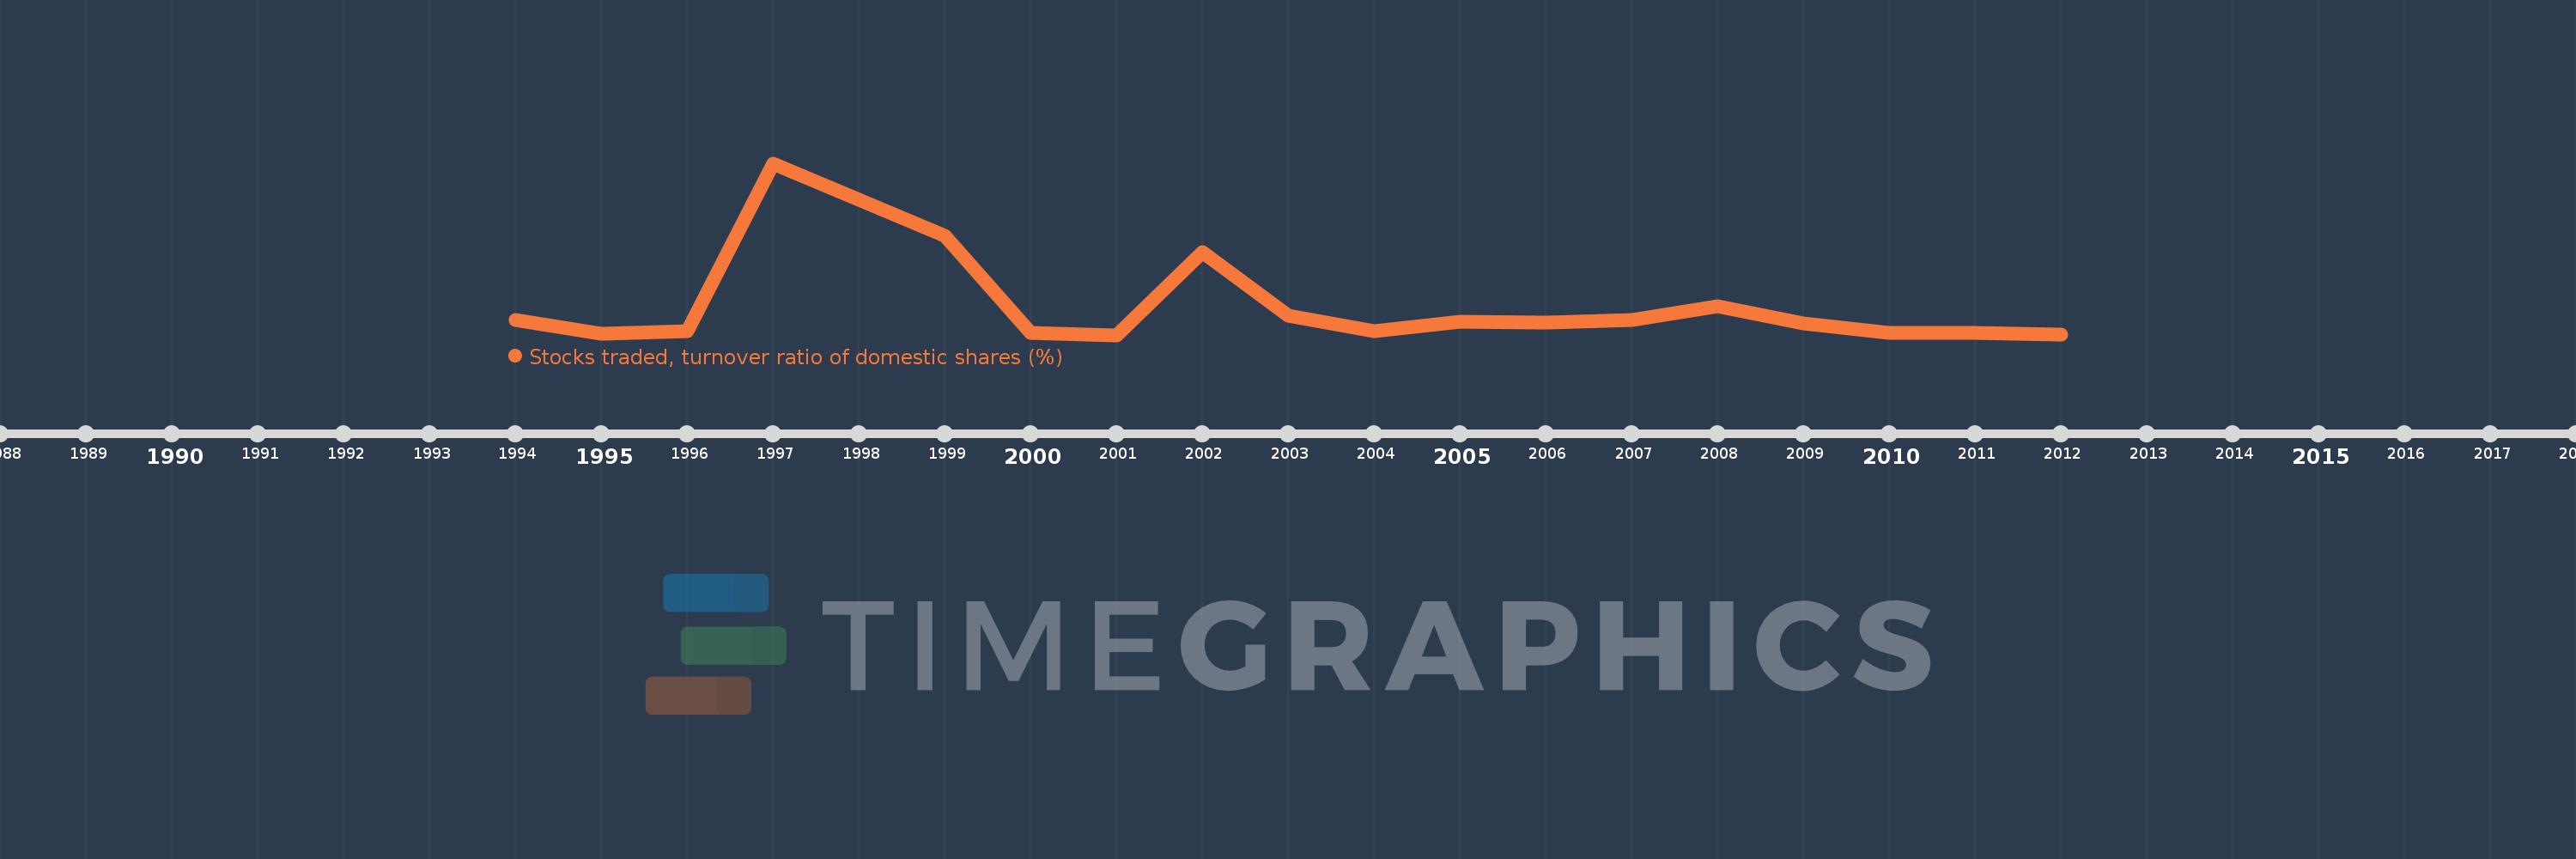
Stocks traded, turnover ratio of domestic shares (%)
2012,2011,2010,2009,2008,2007,2006,2005,2004,2003,2002,2001,2000,1999,1997,1996,1995,1994
Cette statistique dans les autres pays:
La ligne de temps
Cette échelle de temps montre un graphique de 1994 année à 2012 année Bulgaria. Les données jusqu'à 1993 année ne sont pas présentés. Quantité d'observations actuelles selon dates: 18.
Source (désignation):
Les indicateurs du développement mondiale
Source (organisation):
World Federation of Exchanges database.
Catégories:
Financial Sector
Dernière mise à jour
23 avr. 2017
Les indicateurs de changement de valeurs selon les années
Minimum:
3.184
1 janv. 2001
Maximum:
173.036
1 janv. 1997
Pour la date d''observation
Valeur
Changement absolu
Le changement par rapport à la valeur précédente
1 janv. 1994
18.333
+18.333
0.0%
1 janv. 1995
4.555
-13.778
-75.16%
1 janv. 1996
7.224
+2.669
58.6%
1 janv. 1997
173.036
+165.812
2.3 milles%
1 janv. 1999
101.24
-71.795
-41.49%
1 janv. 2000
5.659
-95.581
-94.41%
1 janv. 2001
3.184
-2.475
-43.74%
1 janv. 2002
85.523
+82.339
2.59 milles%
1 janv. 2003
22.601
-62.922
-73.57%
1 janv. 2004
6.621
-15.98
-70.7%
1 janv. 2005
16.339
+9.718
146.77%
1 janv. 2006
15.366
-0.973
-5.95%
1 janv. 2007
18.095
+2.728
17.75%
1 janv. 2008
31.311
+13.216
73.04%
1 janv. 2009
14.806
-16.504
-52.71%
1 janv. 2010
5.629
-9.177
-61.98%
1 janv. 2011
5.114
-0.515
-9.14%
1 janv. 2012
3.9
-1.214
-23.74%
Classement des pays selon les statistiques actuelles par années


Commentaires: