29
/fr/
fr
AIzaSyAYiBZKx7MnpbEhh9jyipgxe19OcubqV5w
April 1, 2024
256851
Sweden
SWE
true
2
1
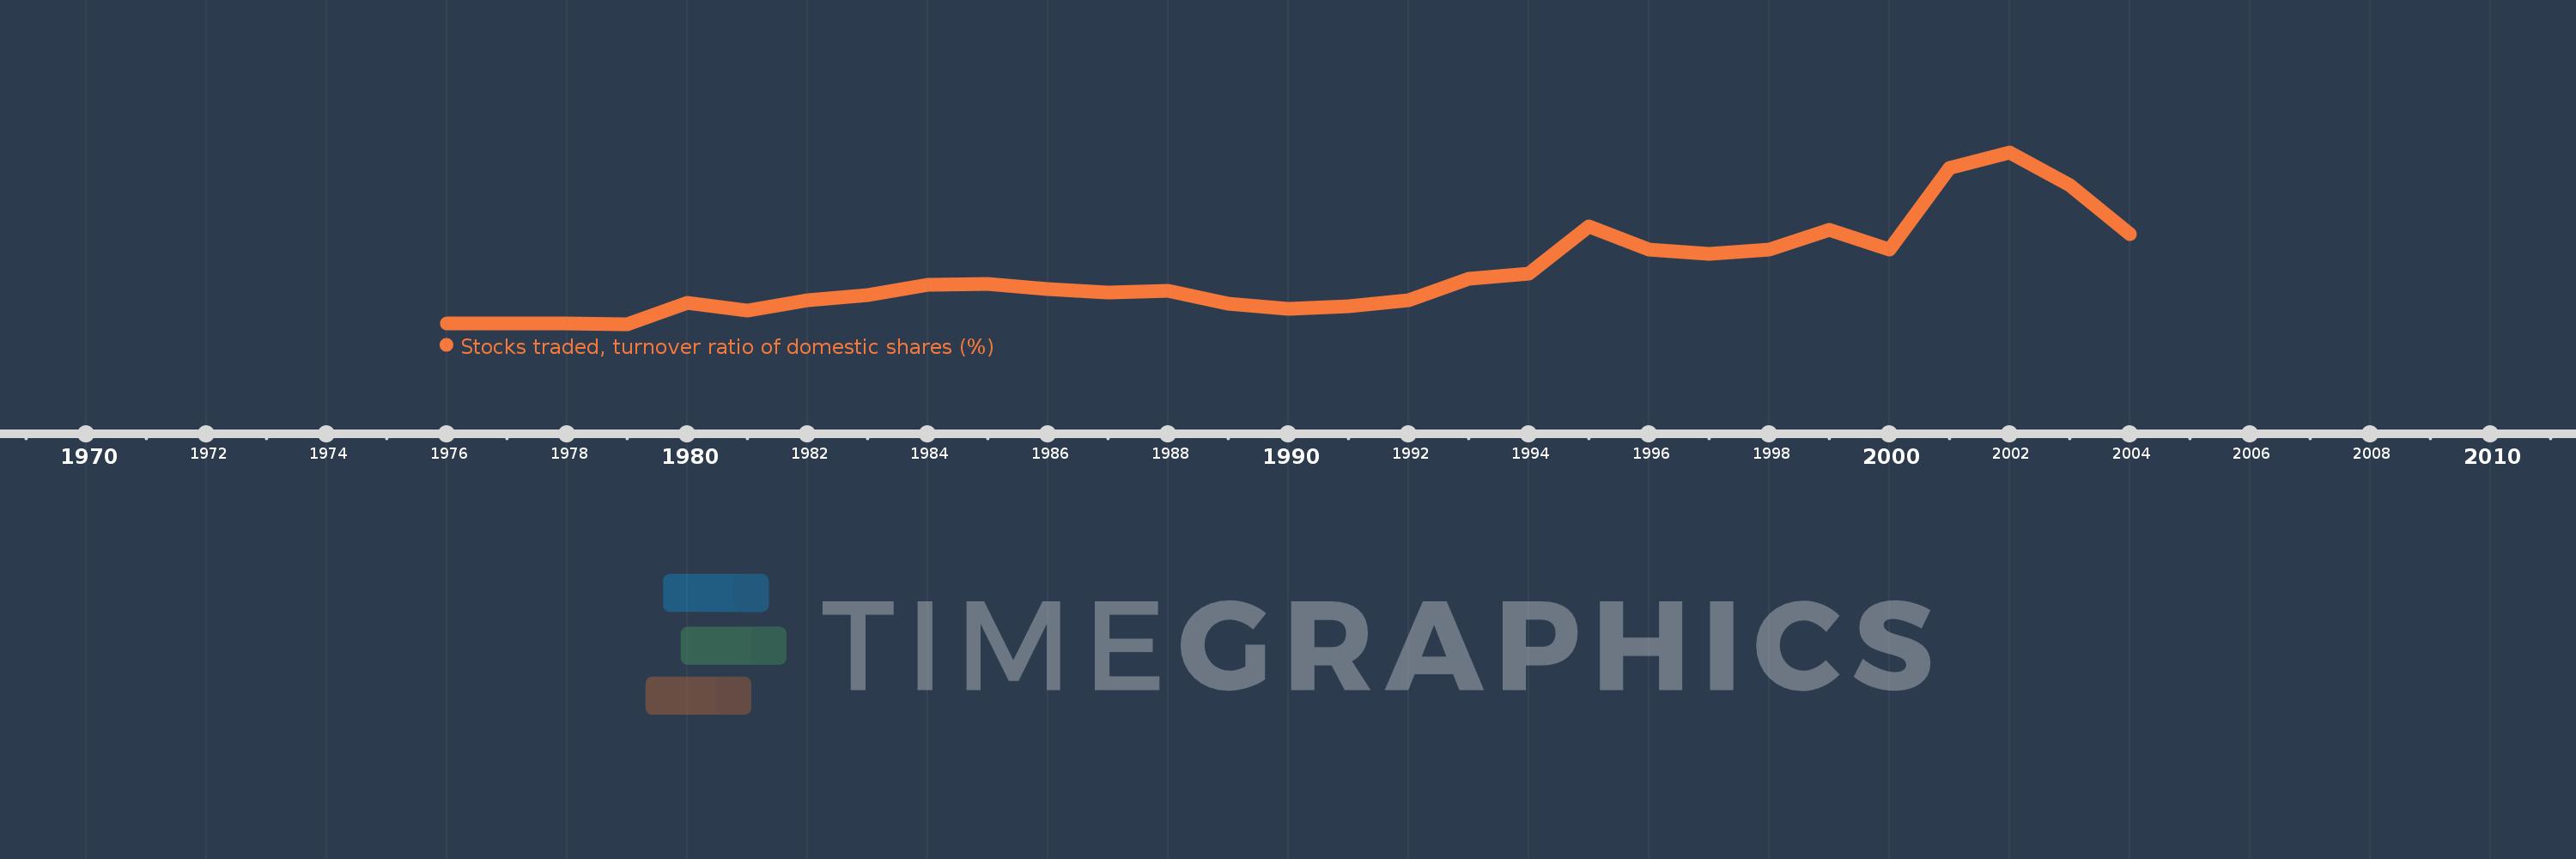
Stocks traded, turnover ratio of domestic shares (%)
2004,2003,2002,2001,2000,1999,1998,1997,1996,1995,1994,1993,1992,1991,1990,1989,1988,1987,1986,1985,1984,1983,1982,1981,1980,1979,1978,1977,1976
Cette statistique dans les autres pays:
La ligne de temps
Cette échelle de temps montre un graphique de 1976 année à 2004 année Sweden. Les données jusqu'à 1975 année ne sont pas présentés. Quantité d'observations actuelles selon dates: 29.
Source (désignation):
Les indicateurs du développement mondiale
Source (organisation):
World Federation of Exchanges database.
Catégories:
Financial Sector
Dernière mise à jour
23 avr. 2017
Les indicateurs de changement de valeurs selon les années
Minimum:
4.147
1 janv. 1979
Maximum:
126.791
1 janv. 2002
Pour la date d''observation
Valeur
Changement absolu
Le changement par rapport à la valeur précédente
1 janv. 1976
4.955
+4.955
0.0%
1 janv. 1977
4.846
-0.108
-2.19%
1 janv. 1978
4.92
+0.074
1.53%
1 janv. 1979
4.147
-0.774
-15.72%
1 janv. 1980
19.317
+15.17
365.83%
1 janv. 1981
13.915
-5.402
-27.96%
1 janv. 1982
21.315
+7.4
53.18%
1 janv. 1983
24.812
+3.497
16.41%
1 janv. 1984
32.559
+7.747
31.22%
1 janv. 1985
32.991
+0.432
1.33%
1 janv. 1986
28.957
-4.034
-12.23%
1 janv. 1987
26.713
-2.244
-7.75%
1 janv. 1988
27.833
+1.121
4.19%
1 janv. 1989
18.723
-9.111
-32.73%
1 janv. 1990
15.125
-3.598
-19.22%
1 janv. 1991
17.025
+1.9
12.56%
1 janv. 1992
21.158
+4.133
24.28%
1 janv. 1993
36.438
+15.28
72.22%
1 janv. 1994
40.402
+3.964
10.88%
1 janv. 1995
74.197
+33.795
83.65%
1 janv. 1996
57.562
-16.635
-22.42%
1 janv. 1997
54.276
-3.286
-5.71%
1 janv. 1998
57.733
+3.457
6.37%
1 janv. 1999
71.677
+13.944
24.15%
1 janv. 2000
57.549
-14.128
-19.71%
1 janv. 2001
115.448
+57.899
100.61%
1 janv. 2002
126.791
+11.343
9.83%
1 janv. 2003
103.601
-23.19
-18.29%
1 janv. 2004
68.455
-35.145
-33.92%
Classement des pays selon les statistiques actuelles par années


Commentaires: