29
/fr/
fr
AIzaSyAYiBZKx7MnpbEhh9jyipgxe19OcubqV5w
April 1, 2024
222946
Peru
PER
true
2
1
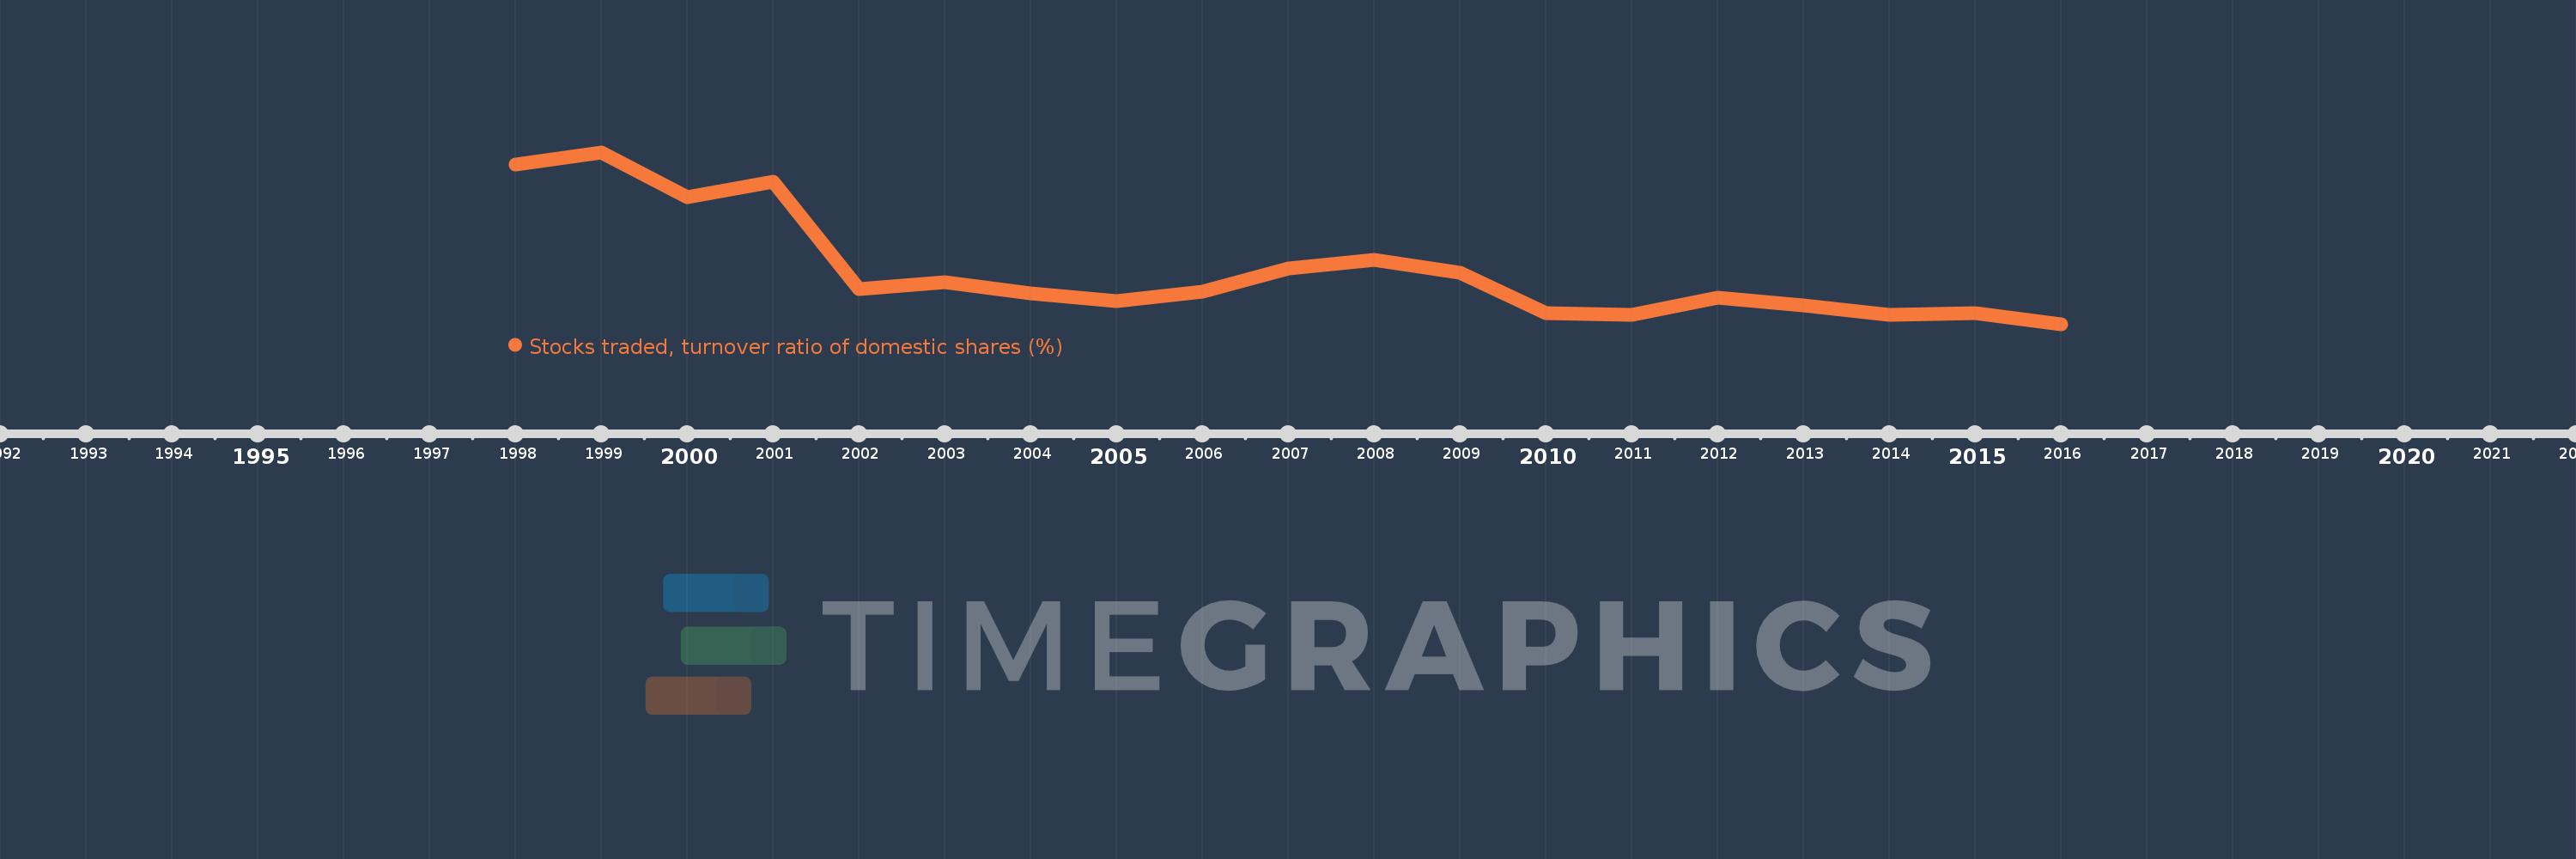
Stocks traded, turnover ratio of domestic shares (%)
2016,2015,2014,2013,2012,2011,2010,2009,2008,2007,2006,2005,2004,2003,2002,2001,2000,1999,1998
Cette statistique dans les autres pays:
La ligne de temps
Cette échelle de temps montre un graphique de 1998 année à 2016 année Peru. Les données jusqu'à 1997 année ne sont pas présentés. Quantité d'observations actuelles selon dates: 19.
Source (désignation):
Les indicateurs du développement mondiale
Source (organisation):
World Federation of Exchanges database.
Catégories:
Financial Sector
Dernière mise à jour
23 avr. 2017
Les indicateurs de changement de valeurs selon les années
Minimum:
2.566
1 janv. 2016
Maximum:
26.624
1 janv. 1999
Pour la date d''observation
Valeur
Changement absolu
Le changement par rapport à la valeur précédente
1 janv. 1998
24.895
+24.895
0.0%
1 janv. 1999
26.624
+1.729
6.95%
1 janv. 2000
20.303
-6.321
-23.74%
1 janv. 2001
22.468
+2.166
10.67%
1 janv. 2002
7.519
-14.949
-66.53%
1 janv. 2003
8.389
+0.87
11.57%
1 janv. 2004
6.862
-1.527
-18.21%
1 janv. 2005
5.849
-1.012
-14.75%
1 janv. 2006
7.108
+1.259
21.52%
1 janv. 2007
10.325
+3.217
45.25%
1 janv. 2008
11.617
+1.292
12.51%
1 janv. 2009
9.719
-1.899
-16.34%
1 janv. 2010
4.129
-5.59
-57.52%
1 janv. 2011
3.864
-0.265
-6.41%
1 janv. 2012
6.322
+2.458
63.6%
1 janv. 2013
5.144
-1.178
-18.63%
1 janv. 2014
3.918
-1.226
-23.83%
1 janv. 2015
4.094
+0.175
4.48%
1 janv. 2016
2.566
-1.528
-37.33%
Classement des pays selon les statistiques actuelles par années


Commentaires: