29
/fr/
fr
AIzaSyAYiBZKx7MnpbEhh9jyipgxe19OcubqV5w
April 1, 2024
156752
Indonesia
IDN
true
2
1
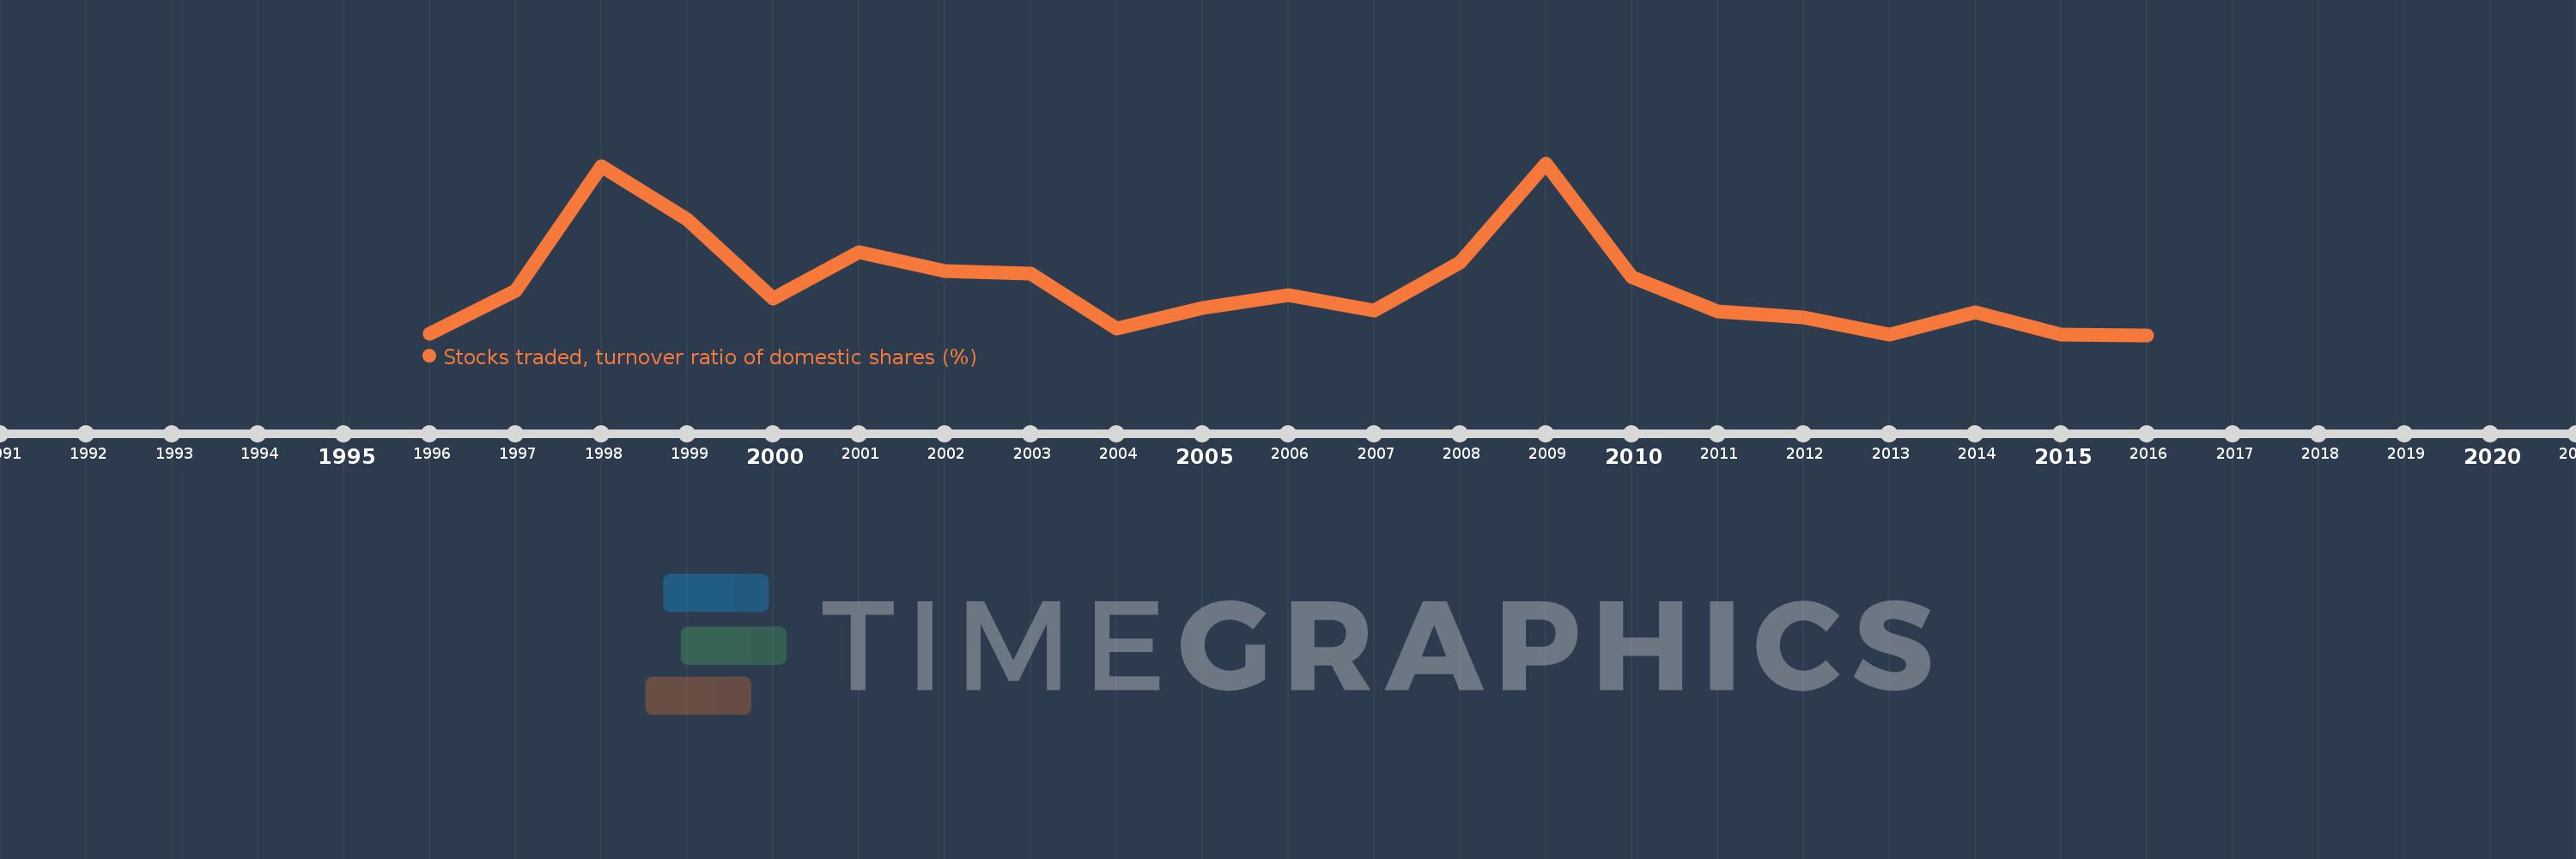
Stocks traded, turnover ratio of domestic shares (%)
2016,2015,2014,2013,2012,2011,2010,2009,2008,2007,2006,2005,2004,2003,2002,2001,2000,1999,1998,1997,1996
Cette statistique dans les autres pays:
La ligne de temps
Cette échelle de temps montre un graphique de 1996 année à 2016 année Indonesia. Les données jusqu'à 1995 année ne sont pas présentés. Quantité d'observations actuelles selon dates: 21.
Source (désignation):
Les indicateurs du développement mondiale
Source (organisation):
World Federation of Exchanges database.
Catégories:
Financial Sector
Dernière mise à jour
23 avr. 2017
Les indicateurs de changement de valeurs selon les années
Minimum:
21.243
1 janv. 2016
Maximum:
76.801
1 janv. 2009
Pour la date d''observation
Valeur
Changement absolu
Le changement par rapport à la valeur précédente
1 janv. 1996
21.588
+21.588
0.0%
1 janv. 1997
35.648
+14.06
65.13%
1 janv. 1998
75.713
+40.065
112.39%
1 janv. 1999
58.569
-17.144
-22.64%
1 janv. 2000
33.042
-25.527
-43.58%
1 janv. 2001
48.118
+15.077
45.63%
1 janv. 2002
41.909
-6.21
-12.9%
1 janv. 2003
41.2
-0.708
-1.69%
1 janv. 2004
23.345
-17.855
-43.34%
1 janv. 2005
29.868
+6.523
27.94%
1 janv. 2006
34.213
+4.345
14.55%
1 janv. 2007
29.033
-5.18
-15.14%
1 janv. 2008
44.836
+15.803
54.43%
1 janv. 2009
76.801
+31.965
71.29%
1 janv. 2010
40.045
-36.756
-47.86%
1 janv. 2011
28.983
-11.062
-27.62%
1 janv. 2012
27.038
-1.946
-6.71%
1 janv. 2013
21.468
-5.57
-20.6%
1 janv. 2014
28.516
+7.048
32.83%
1 janv. 2015
21.492
-7.025
-24.63%
1 janv. 2016
21.243
-0.249
-1.16%
Classement des pays selon les statistiques actuelles par années


Commentaires: