29
/
en
AIzaSyAYiBZKx7MnpbEhh9jyipgxe19OcubqV5w
April 1, 2024
156752
Indonesia
IDN
true
2
1
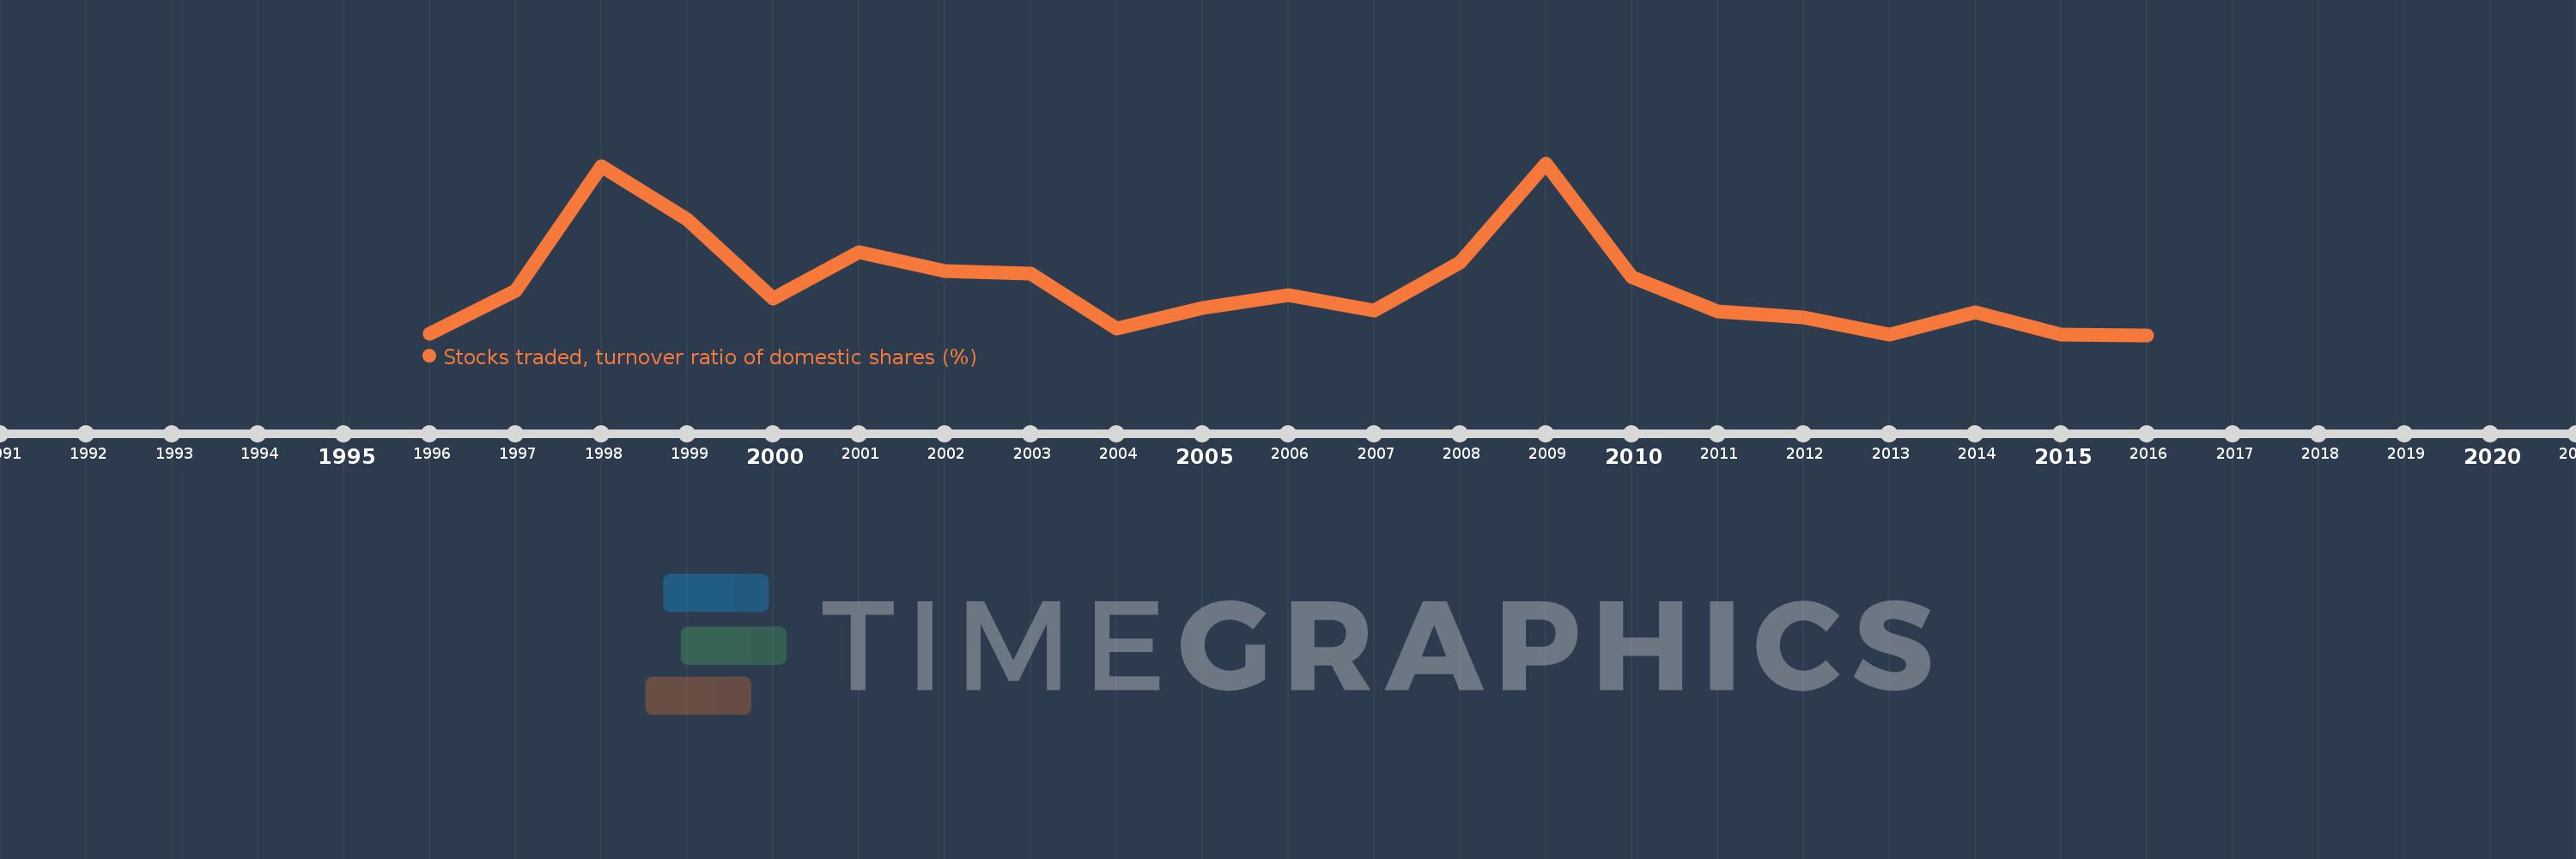
Stocks traded, turnover ratio of domestic shares (%)
2016,2015,2014,2013,2012,2011,2010,2009,2008,2007,2006,2005,2004,2003,2002,2001,2000,1999,1998,1997,1996
This statistics in other country:
Timeline:
This timeline shows a graph from 1996 to 2016 of Indonesia. No data until 1995. Number of actual observations by date: 21.
Source name:
World Development Indicators
Source organization:
World Federation of Exchanges database.
Categories, topics:
Financial Sector
Last updated:
apr 23, 2017
Indicators value changes by year
Minimum:
21.243
jan 1, 2016
Maximum:
76.801
jan 1, 2009
At the date of observation
Value
Absolute change
Change from previous value
jan 1, 1996
21.588
+21.588
0.0%
jan 1, 1997
35.648
+14.06
65.13%
jan 1, 1998
75.713
+40.065
112.39%
jan 1, 1999
58.569
-17.144
-22.64%
jan 1, 2000
33.042
-25.527
-43.58%
jan 1, 2001
48.118
+15.077
45.63%
jan 1, 2002
41.909
-6.21
-12.9%
jan 1, 2003
41.2
-0.708
-1.69%
jan 1, 2004
23.345
-17.855
-43.34%
jan 1, 2005
29.868
+6.523
27.94%
jan 1, 2006
34.213
+4.345
14.55%
jan 1, 2007
29.033
-5.18
-15.14%
jan 1, 2008
44.836
+15.803
54.43%
jan 1, 2009
76.801
+31.965
71.29%
jan 1, 2010
40.045
-36.756
-47.86%
jan 1, 2011
28.983
-11.062
-27.62%
jan 1, 2012
27.038
-1.946
-6.71%
jan 1, 2013
21.468
-5.57
-20.6%
jan 1, 2014
28.516
+7.048
32.83%
jan 1, 2015
21.492
-7.025
-24.63%
jan 1, 2016
21.243
-0.249
-1.16%
Ranking of countries by current statistics by years


Comments: