29
/
en
AIzaSyAYiBZKx7MnpbEhh9jyipgxe19OcubqV5w
April 1, 2024
263015
Thailand
THA
true
2
1
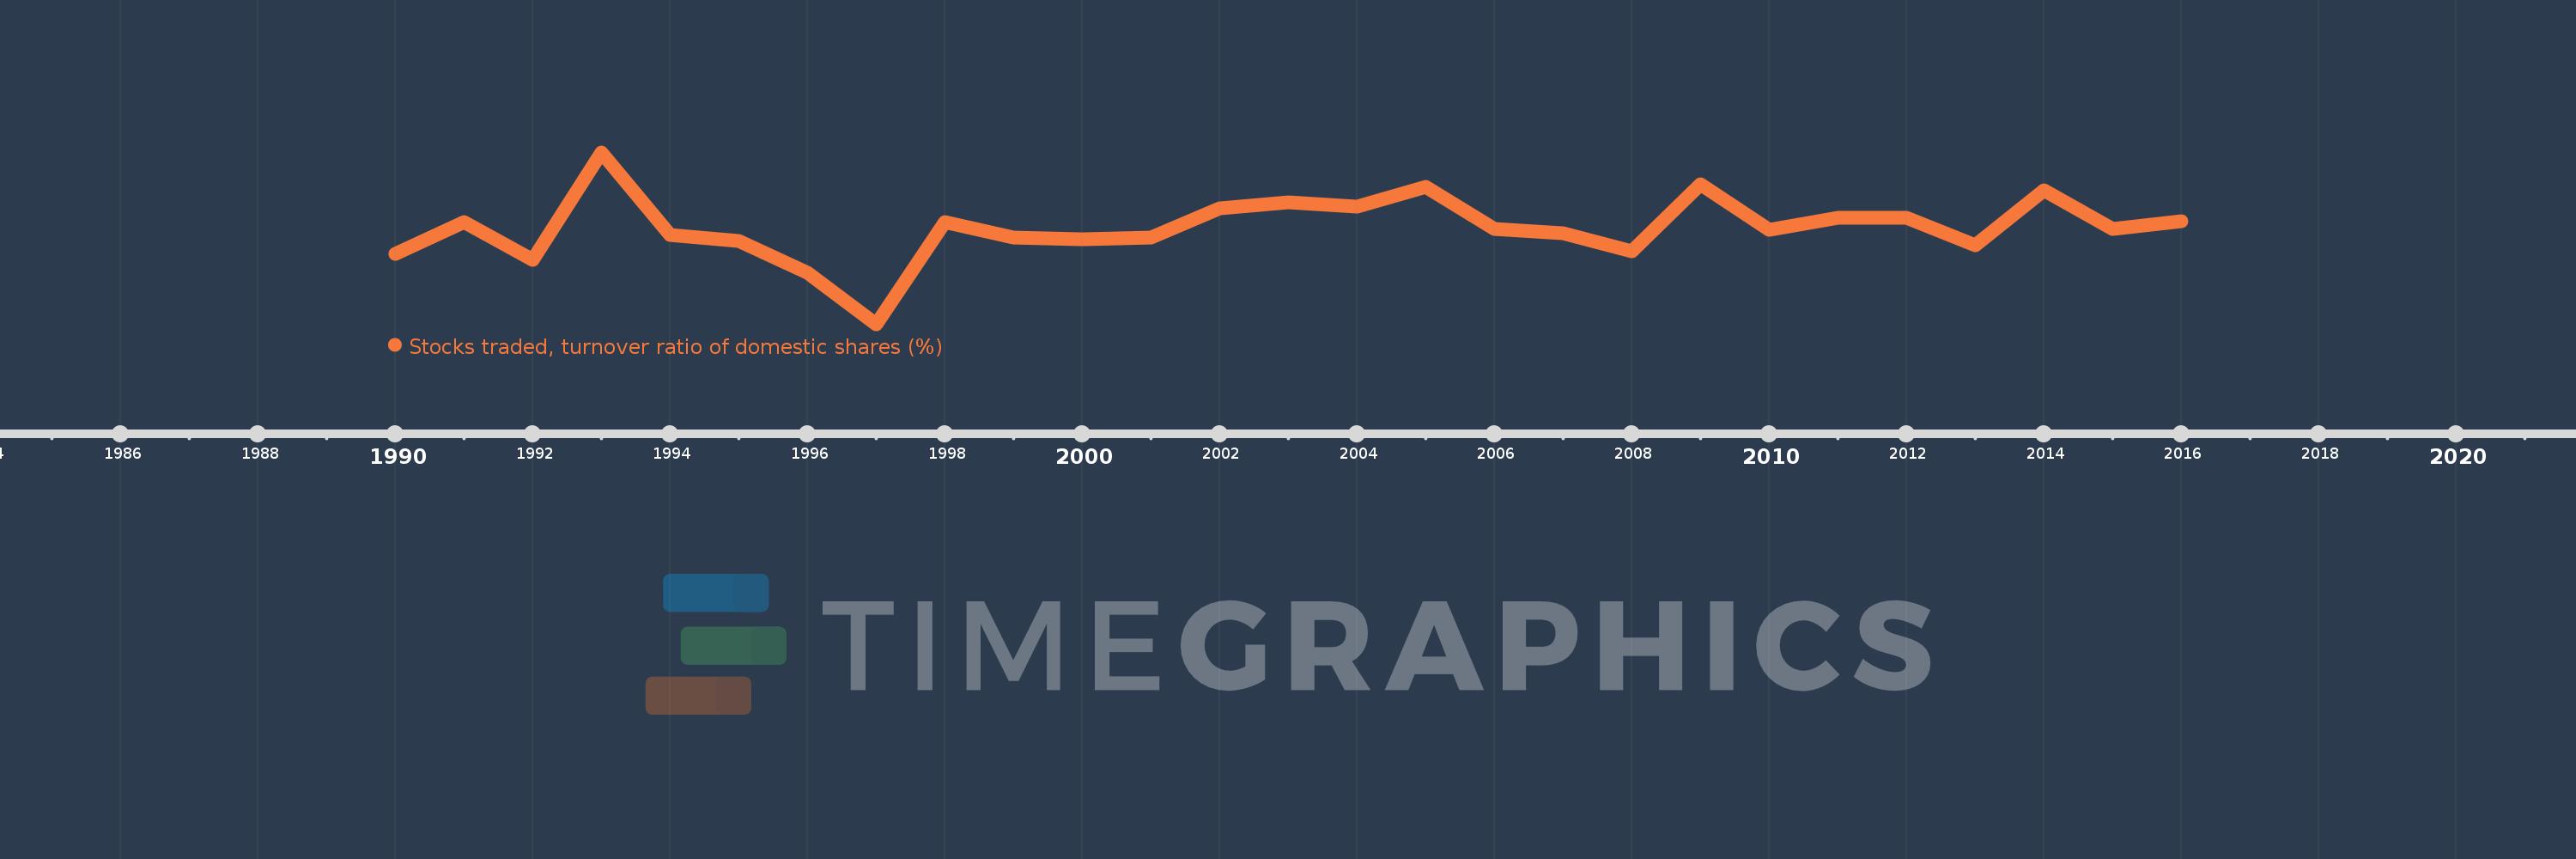
Stocks traded, turnover ratio of domestic shares (%)
2016,2015,2014,2013,2012,2011,2010,2009,2008,2007,2006,2005,2004,2003,2002,2001,2000,1999,1998,1997,1996,1995,1994,1993,1992,1991,1990
This statistics in other country:
Timeline:
This timeline shows a graph from 1990 to 2016 of Thailand. No data until 1989. Number of actual observations by date: 27.
Source name:
World Development Indicators
Source organization:
World Federation of Exchanges database.
Categories, topics:
Financial Sector
Last updated:
apr 23, 2017
Indicators value changes by year
Maximum:
124.734
jan 1, 1993
At the date of observation
Value
Absolute change
Change from previous value
jan 1, 1990
55.108
+55.108
0.0%
jan 1, 1991
76.937
+21.829
39.61%
jan 1, 1992
50.963
-25.975
-33.76%
jan 1, 1993
124.734
+73.771
144.76%
jan 1, 1994
67.985
-56.748
-45.5%
jan 1, 1995
63.757
-4.229
-6.22%
jan 1, 1996
41.998
-21.759
-34.13%
jan 1, 1997
6.902
-35.096
-83.57%
jan 1, 1998
77.143
+70.241
1.02K%
jan 1, 1999
66.187
-10.956
-14.2%
jan 1, 2000
65.249
-0.938
-1.42%
jan 1, 2001
66.163
+0.914
1.4%
jan 1, 2002
86.389
+20.226
30.57%
jan 1, 2003
90.717
+4.329
5.01%
jan 1, 2004
87.844
-2.873
-3.17%
jan 1, 2005
101.34
+13.496
15.36%
jan 1, 2006
72.503
-28.837
-28.46%
jan 1, 2007
69.213
-3.29
-4.54%
jan 1, 2008
57.197
-12.016
-17.36%
jan 1, 2009
102.84
+45.644
79.8%
jan 1, 2010
71.555
-31.285
-30.42%
jan 1, 2011
80.088
+8.533
11.93%
jan 1, 2012
80.179
+0.09
0.11%
jan 1, 2013
61.282
-18.897
-23.57%
jan 1, 2014
98.743
+37.46
61.13%
jan 1, 2015
72.17
-26.573
-26.91%
jan 1, 2016
77.786
+5.616
7.78%
Ranking of countries by current statistics by years


Comments: