29
/
en
AIzaSyAYiBZKx7MnpbEhh9jyipgxe19OcubqV5w
April 1, 2024
102005
Cayman Islands
CYM
true
2
1
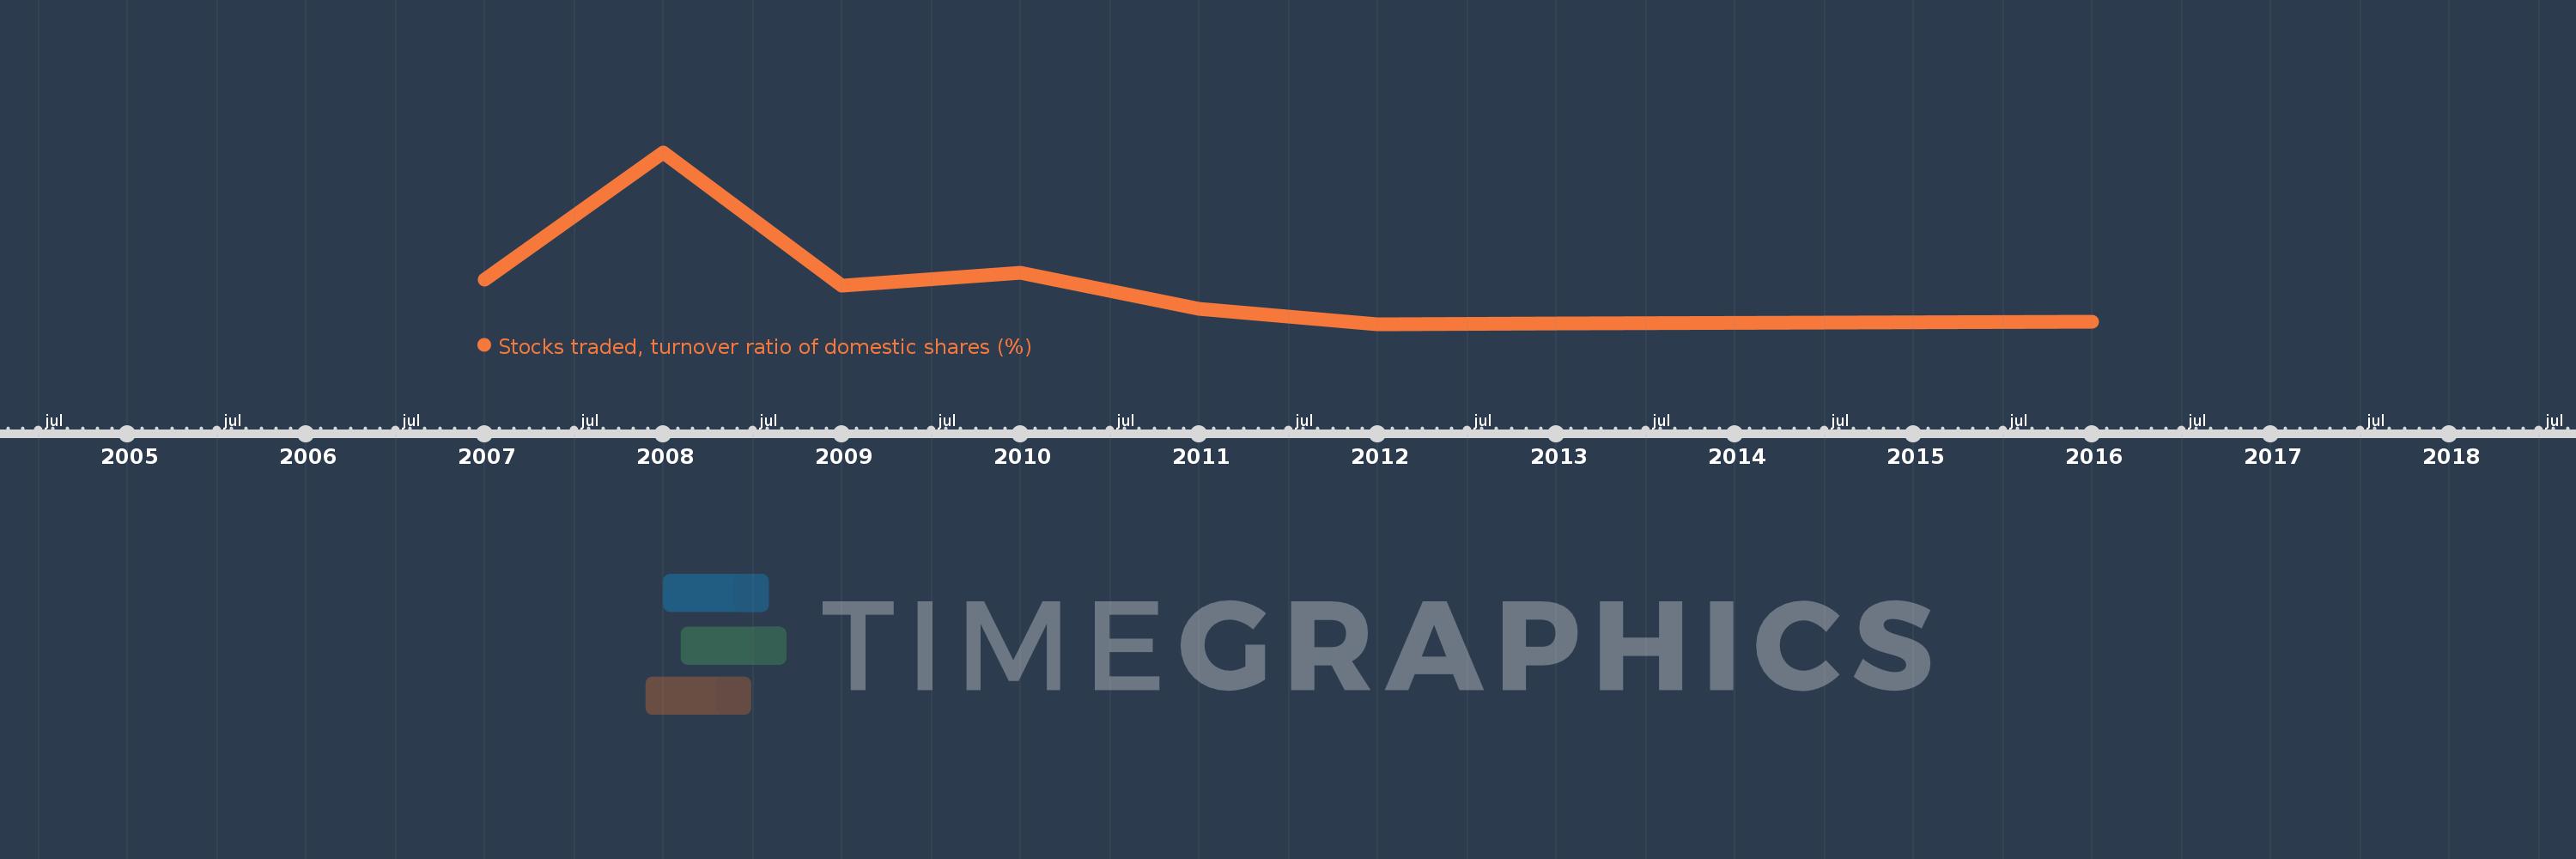
Stocks traded, turnover ratio of domestic shares (%)
2016,2013,2012,2011,2010,2009,2008,2007
This statistics in other country:
Timeline:
This timeline shows a graph from 2007 to 2016 of Cayman Islands. No data until 2006. Number of actual observations by date: 8.
Source name:
World Development Indicators
Source organization:
World Federation of Exchanges database.
Categories, topics:
Financial Sector
Last updated:
apr 23, 2017
Indicators value changes by year
At the date of observation
Value
Absolute change
Change from previous value
jan 1, 2008
3.515
+2.515
251.52%
jan 1, 2009
0.881
-2.635
-74.95%
jan 1, 2010
1.124
+0.244
27.68%
jan 1, 2011
0.42
-0.704
-62.63%
jan 1, 2012
0.112
-0.309
-73.44%
jan 1, 2013
0.127
+0.015
13.44%
jan 1, 2016
0.158
+0.032
25.13%
Ranking of countries by current statistics by years


Comments: