29
/
en
AIzaSyAYiBZKx7MnpbEhh9jyipgxe19OcubqV5w
April 1, 2024
196307
Mexico
MEX
true
2
1
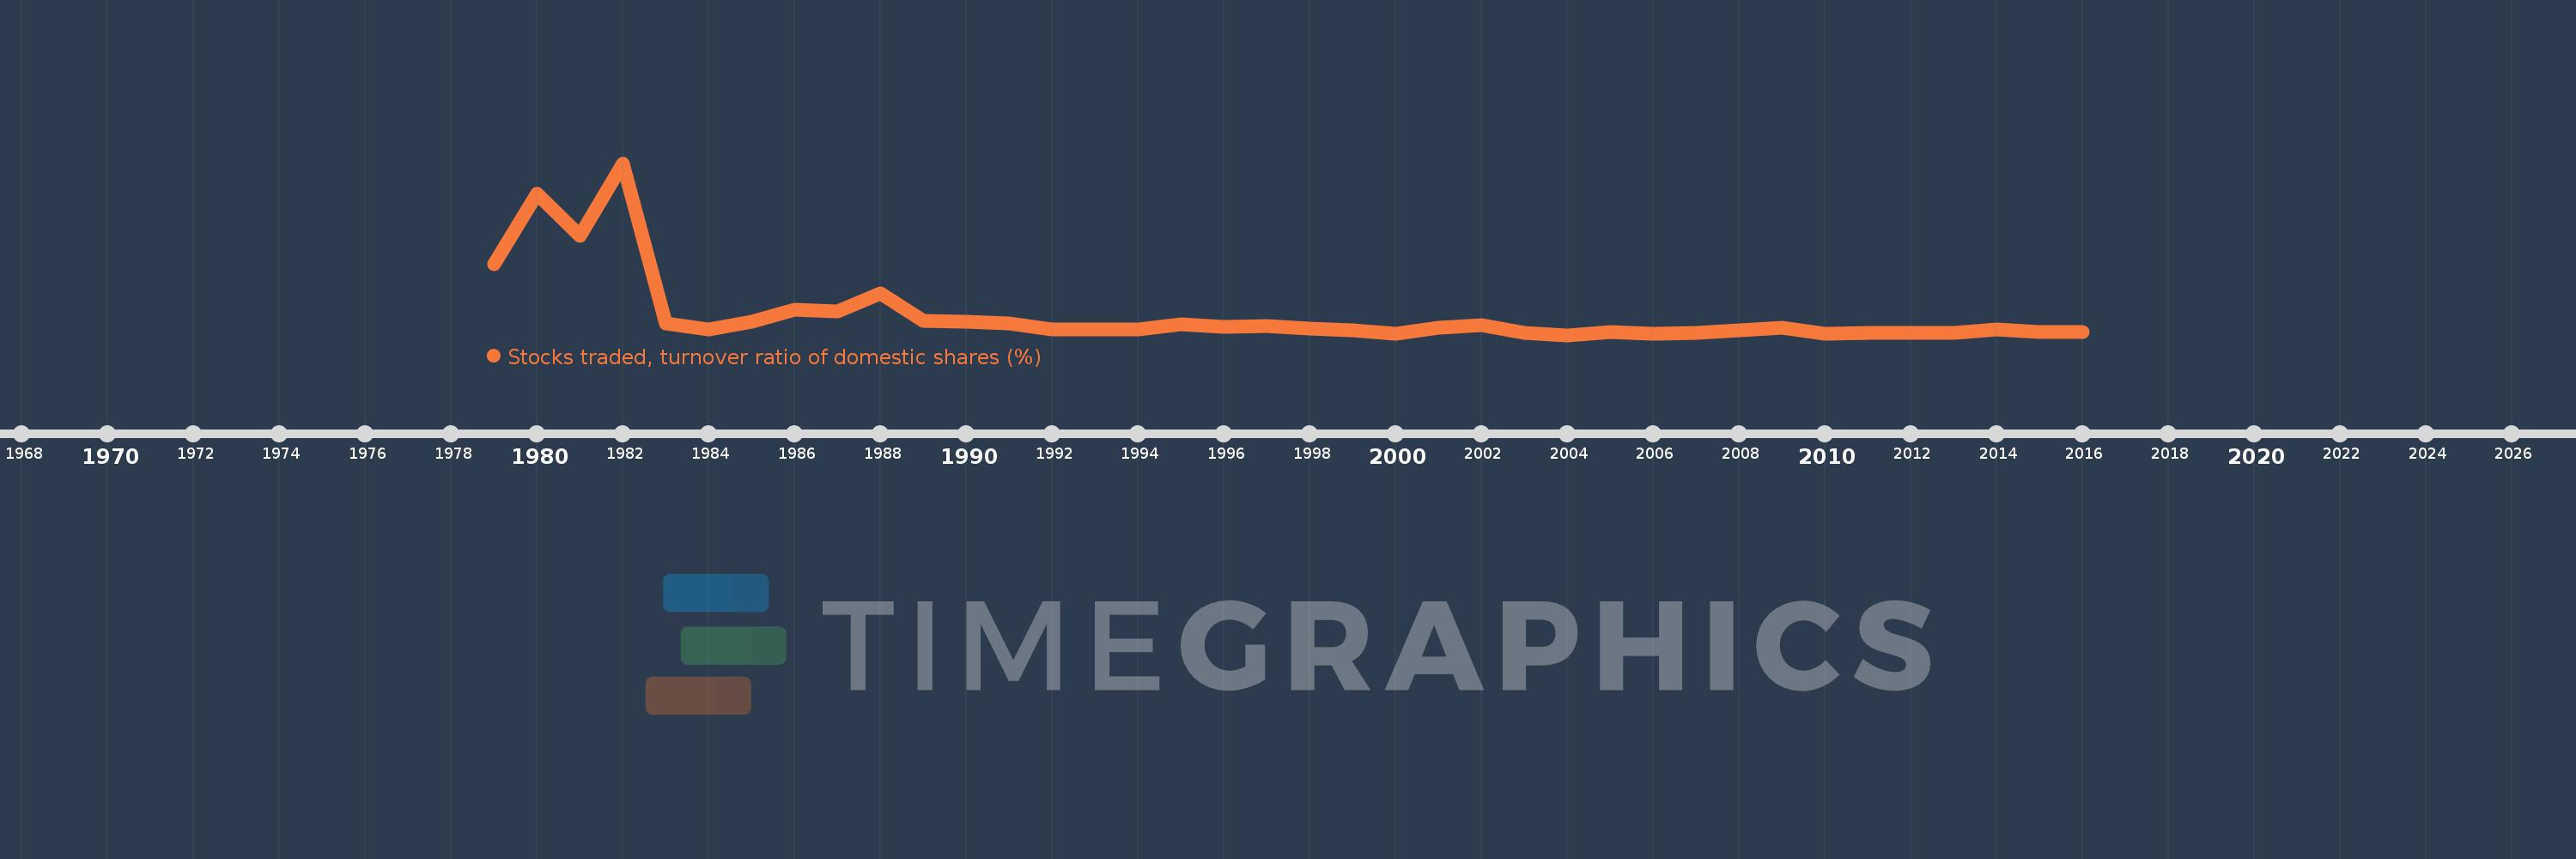
Stocks traded, turnover ratio of domestic shares (%)
2016,2015,2014,2013,2012,2011,2010,2009,2008,2007,2006,2005,2004,2003,2002,2001,2000,1999,1998,1997,1996,1995,1994,1993,1992,1991,1990,1989,1988,1987,1986,1985,1984,1983,1982,1981,1980,1979
This statistics in other country:
Timeline:
This timeline shows a graph from 1979 to 2016 of Mexico. No data until 1978. Number of actual observations by date: 38.
Source name:
World Development Indicators
Source organization:
World Federation of Exchanges database.
Categories, topics:
Financial Sector
Last updated:
apr 23, 2017
Indicators value changes by year
Minimum:
18.838
jan 1, 2004
Maximum:
413.96
jan 1, 1982
At the date of observation
Value
Absolute change
Change from previous value
jan 1, 1979
181.03
+181.03
0.0%
jan 1, 1980
343.632
+162.602
89.82%
jan 1, 1981
247.854
-95.778
-27.87%
jan 1, 1982
413.96
+166.107
67.02%
jan 1, 1983
45.471
-368.489
-89.02%
jan 1, 1984
30.889
-14.581
-32.07%
jan 1, 1985
50.143
+19.253
62.33%
jan 1, 1986
77.816
+27.673
55.19%
jan 1, 1987
72.599
-5.217
-6.7%
jan 1, 1988
115.137
+42.538
58.59%
jan 1, 1989
50.474
-64.663
-56.16%
jan 1, 1990
50.028
-0.447
-0.88%
jan 1, 1991
45.159
-4.869
-9.73%
jan 1, 1992
30.798
-14.36
-31.8%
jan 1, 1993
31.825
+1.027
3.33%
jan 1, 1994
31.163
-0.662
-2.08%
jan 1, 1995
43.893
+12.73
40.85%
jan 1, 1996
37.7
-6.192
-14.11%
jan 1, 1997
40.388
+2.688
7.13%
jan 1, 1998
33.018
-7.37
-18.25%
jan 1, 1999
30.476
-2.543
-7.7%
jan 1, 2000
22.676
-7.8
-25.59%
jan 1, 2001
35.702
+13.026
57.45%
jan 1, 2002
42.048
+6.346
17.77%
jan 1, 2003
24.472
-17.576
-41.8%
jan 1, 2004
18.838
-5.634
-23.02%
jan 1, 2005
25.806
+6.968
36.99%
jan 1, 2006
22.786
-3.02
-11.7%
jan 1, 2007
23.494
+0.709
3.11%
jan 1, 2008
29.649
+6.155
26.2%
jan 1, 2009
36.257
+6.608
22.29%
jan 1, 2010
22.03
-14.226
-39.24%
jan 1, 2011
24.457
+2.427
11.02%
jan 1, 2012
24.417
-0.04
-0.16%
jan 1, 2013
22.795
-1.622
-6.64%
jan 1, 2014
31.119
+8.324
36.52%
jan 1, 2015
26.66
-4.459
-14.33%
jan 1, 2016
25.768
-0.892
-3.35%
Ranking of countries by current statistics by years


Comments: