29
/
en
AIzaSyAYiBZKx7MnpbEhh9jyipgxe19OcubqV5w
April 1, 2024
187245
Malawi
MWI
true
2
1
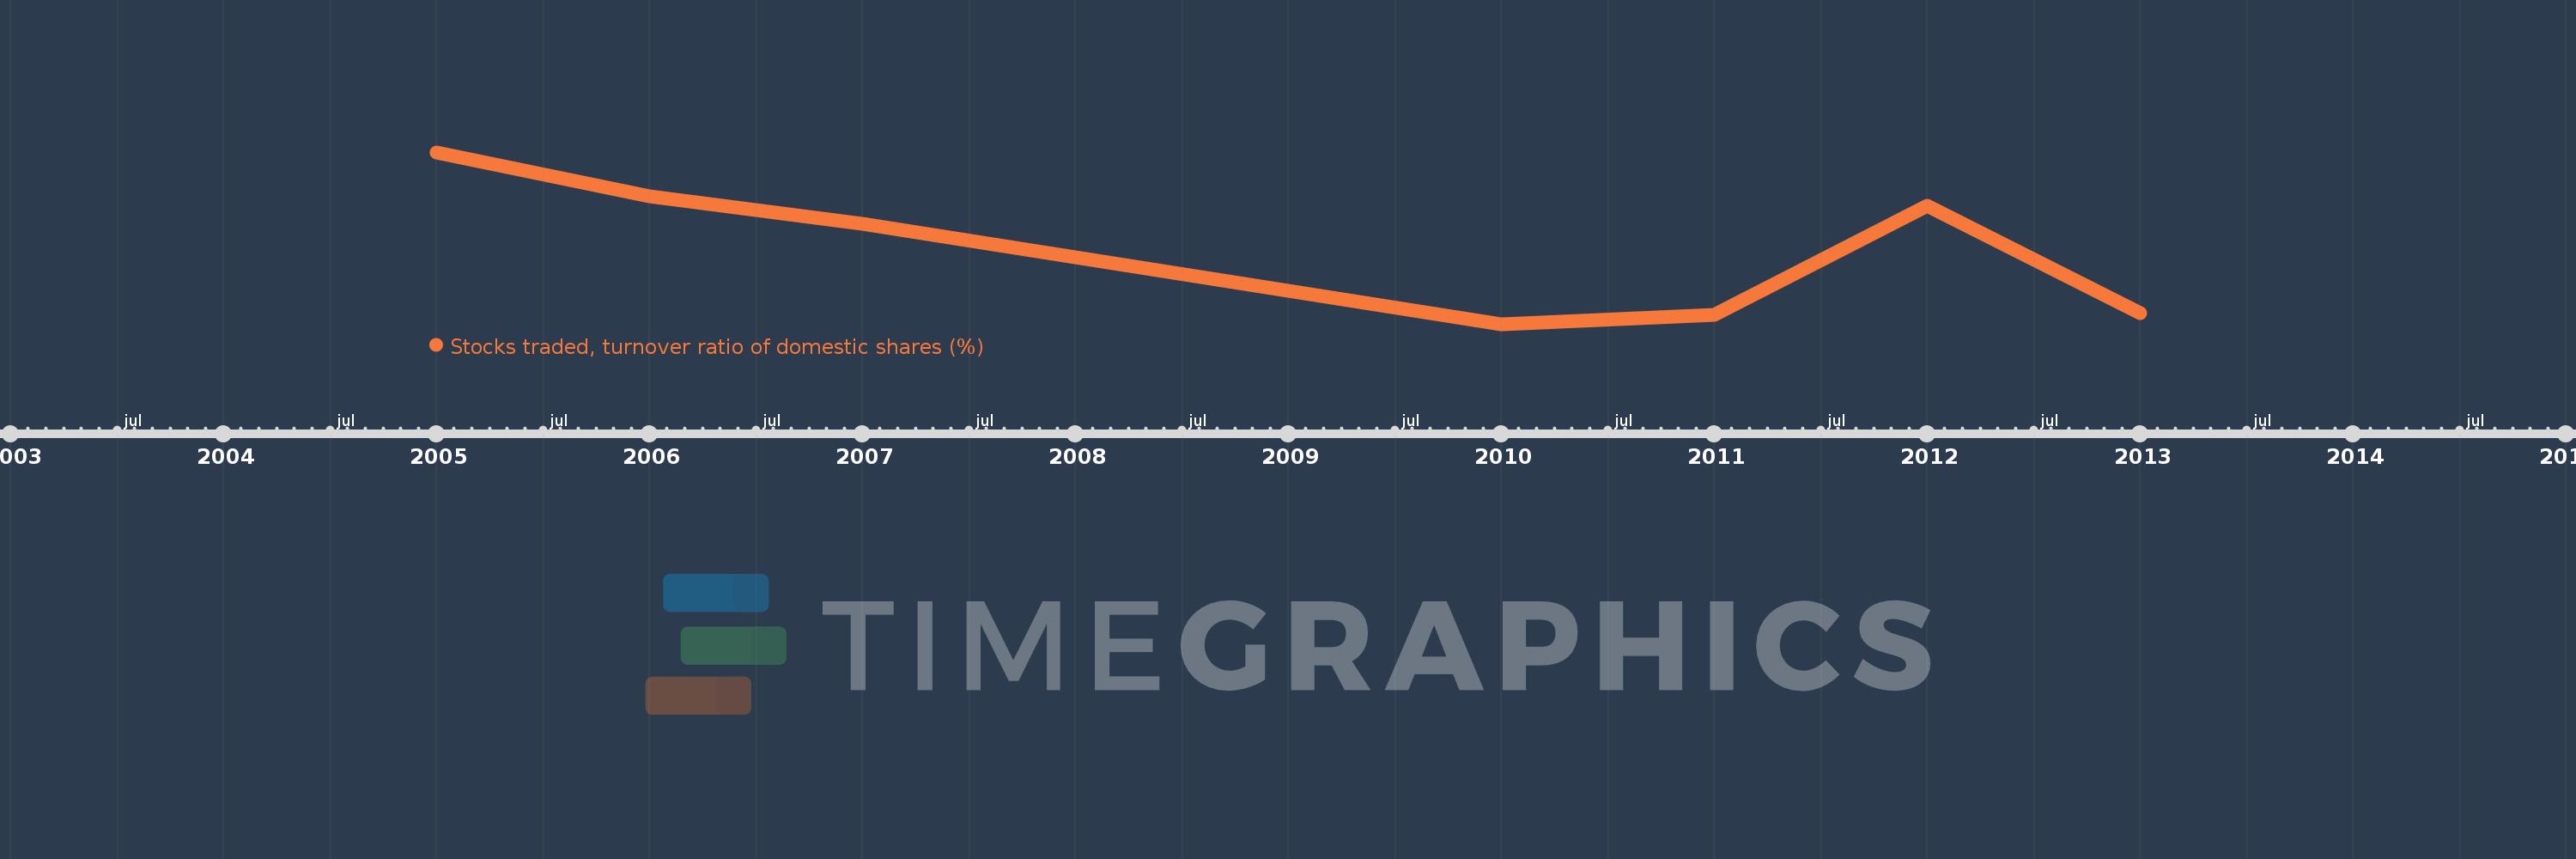
Stocks traded, turnover ratio of domestic shares (%)
2013,2012,2011,2010,2007,2006,2005
This statistics in other country:
Timeline:
This timeline shows a graph from 2005 to 2013 of Malawi. No data until 2004. Number of actual observations by date: 7.
Source name:
World Development Indicators
Source organization:
World Federation of Exchanges database.
Categories, topics:
Financial Sector
Last updated:
apr 23, 2017
Indicators value changes by year
At the date of observation
Value
Absolute change
Change from previous value
jan 1, 2005
5.071
+5.071
0.0%
jan 1, 2006
4.09
-0.981
-19.34%
jan 1, 2007
3.491
-0.599
-14.65%
jan 1, 2010
1.25
-2.241
-64.2%
jan 1, 2011
1.457
+0.207
16.53%
jan 1, 2012
3.884
+2.427
166.62%
jan 1, 2013
1.506
-2.377
-61.21%
Ranking of countries by current statistics by years


Comments: