29
/
en
AIzaSyAYiBZKx7MnpbEhh9jyipgxe19OcubqV5w
April 1, 2024
35394
Heavily indebted poor countries (HIPC)
HPC
false
2
1
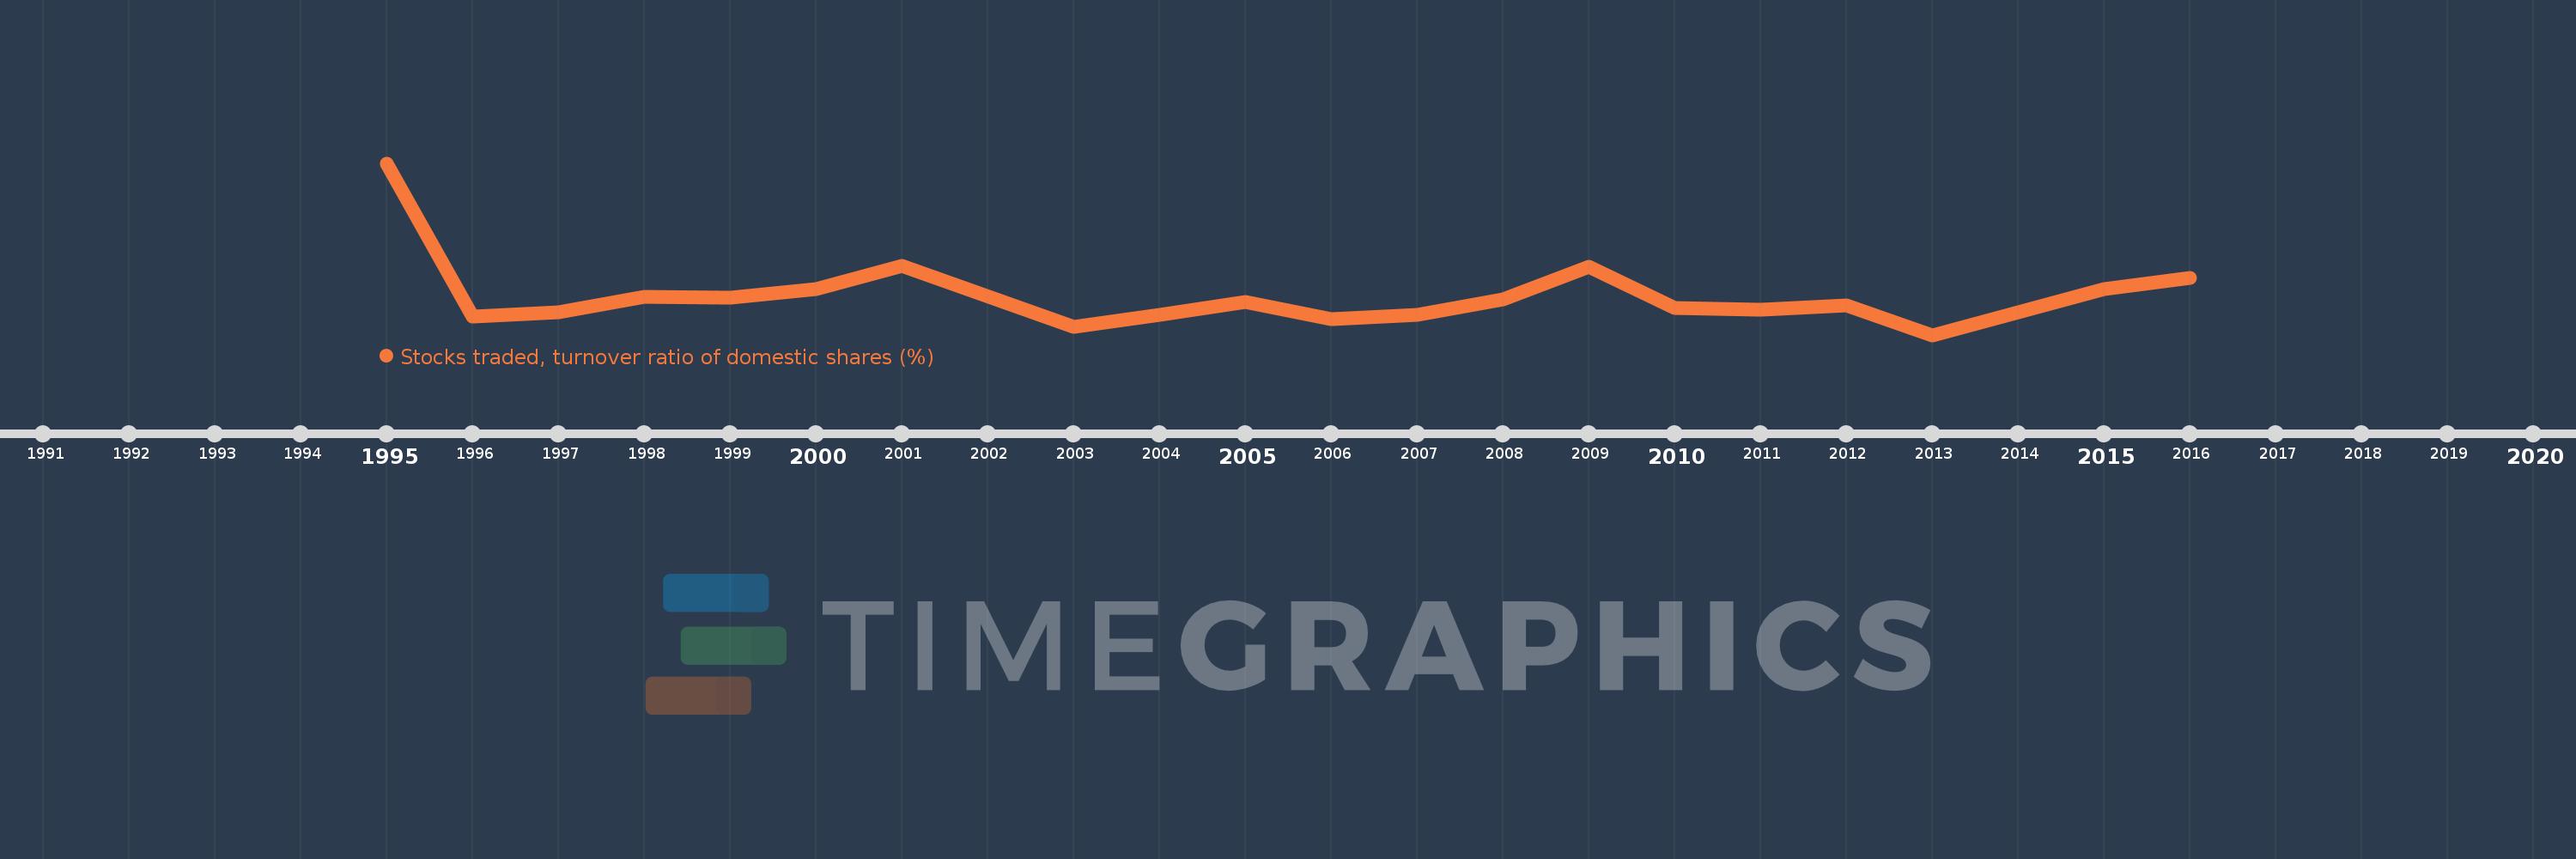
Stocks traded, turnover ratio of domestic shares (%)
2016,2015,2013,2012,2011,2010,2009,2008,2007,2006,2005,2004,2003,2001,2000,1999,1998,1997,1996,1995
This statistics in other country:
Timeline:
This timeline shows a graph from 1995 to 2016 of Heavily indebted poor countries (HIPC). No data until 1994. Number of actual observations by date: 20.
Source name:
World Development Indicators
Source organization:
World Federation of Exchanges database.
Categories, topics:
Financial Sector
Last updated:
apr 23, 2017
Indicators value changes by year
Maximum:
11.823
jan 1, 1995
At the date of observation
Value
Absolute change
Change from previous value
jan 1, 1995
11.823
+11.823
0.0%
jan 1, 1996
1.613
-10.21
-86.36%
jan 1, 1997
1.866
+0.253
15.67%
jan 1, 1998
2.923
+1.057
56.68%
jan 1, 1999
2.844
-0.079
-2.7%
jan 1, 2000
3.452
+0.607
21.36%
jan 1, 2001
4.979
+1.528
44.26%
jan 1, 2003
0.917
-4.062
-81.58%
jan 1, 2004
1.708
+0.791
86.29%
jan 1, 2005
2.577
+0.869
50.84%
jan 1, 2006
1.416
-1.161
-45.05%
jan 1, 2007
1.706
+0.29
20.51%
jan 1, 2008
2.735
+1.029
60.32%
jan 1, 2009
4.911
+2.176
79.53%
jan 1, 2010
2.19
-2.721
-55.41%
jan 1, 2011
2.08
-0.11
-5.01%
jan 1, 2012
2.326
+0.246
11.8%
jan 1, 2013
0.364
-1.962
-84.36%
jan 1, 2015
3.407
+3.043
836.83%
jan 1, 2016
4.177
+0.77
22.6%
Ranking of countries by current statistics by years


Comments: