29
/
en
AIzaSyAYiBZKx7MnpbEhh9jyipgxe19OcubqV5w
April 1, 2024
33082
Europe & Central Asia (IDA & IBRD countries)
TEC
false
2
1
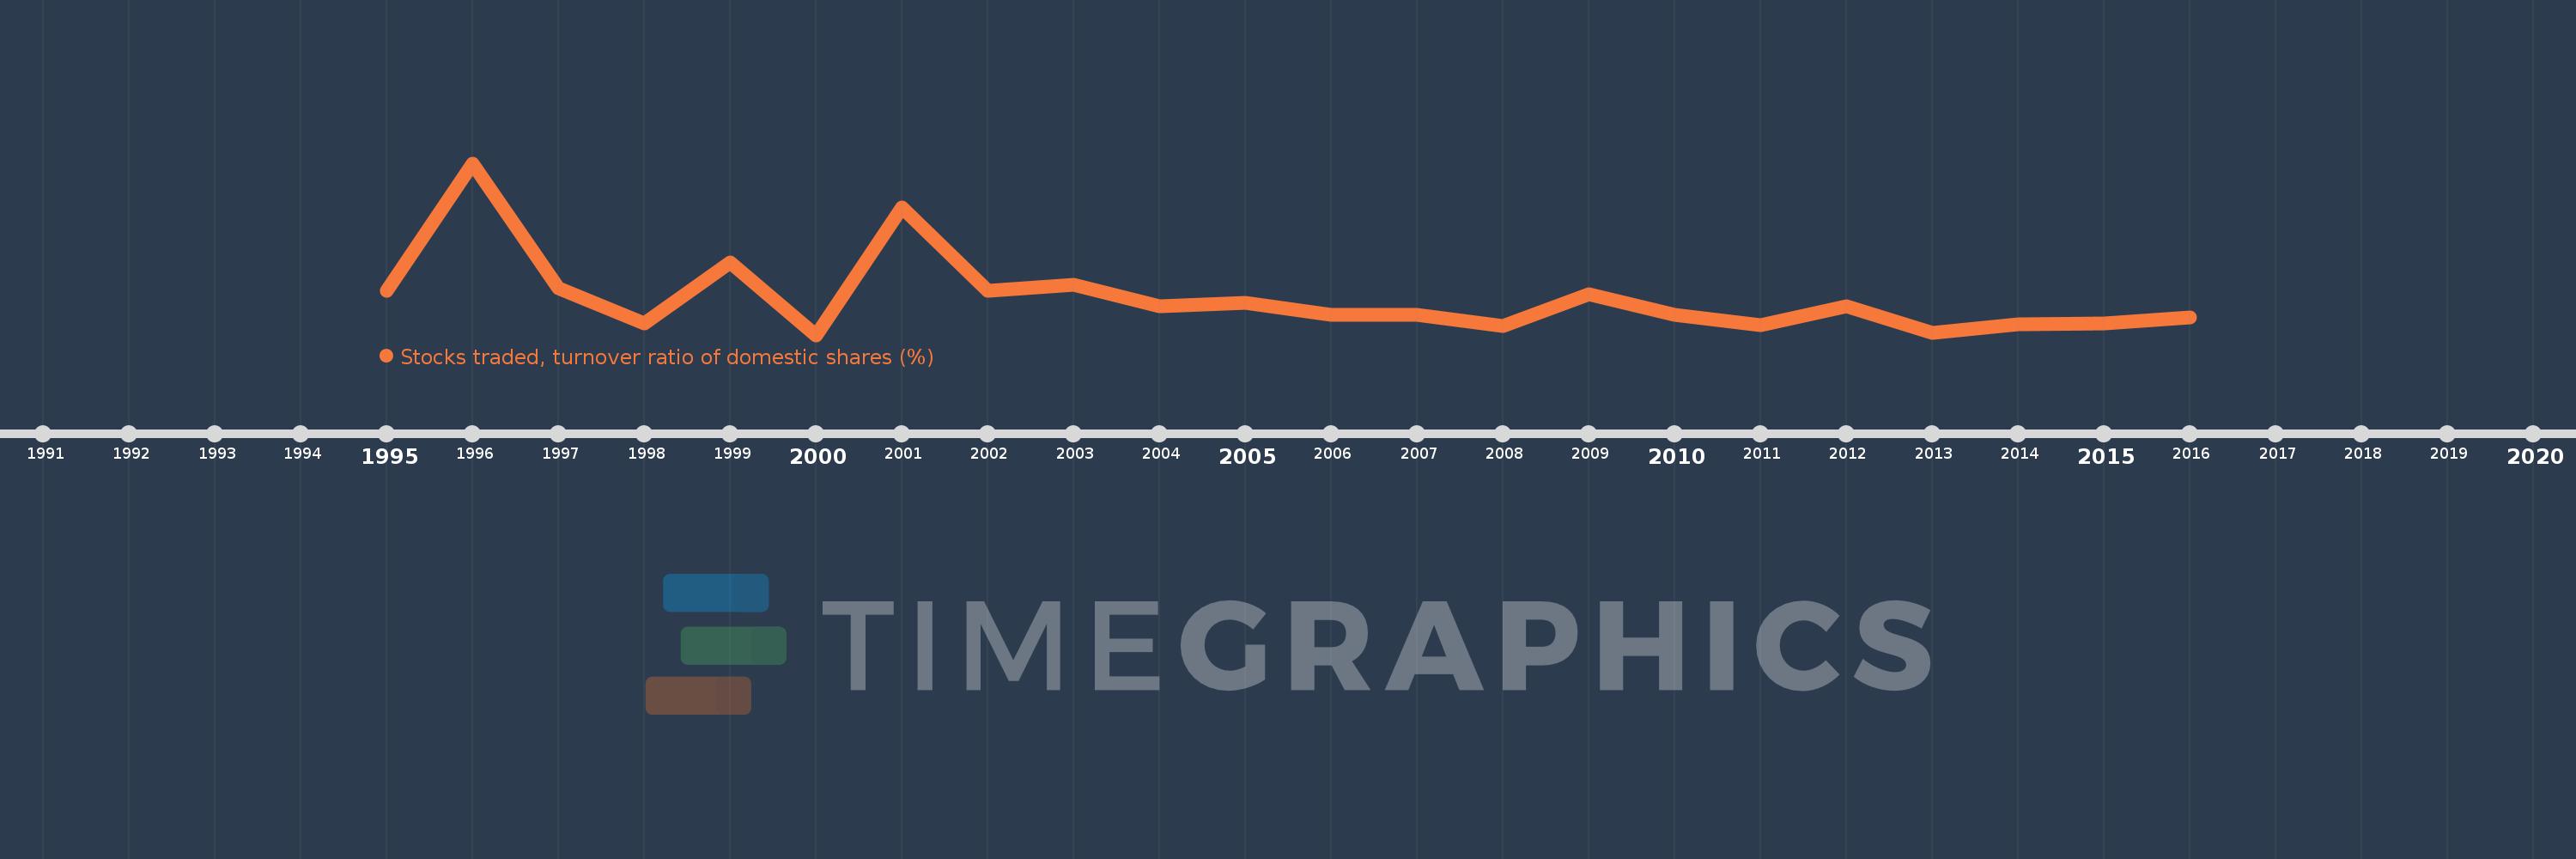
Stocks traded, turnover ratio of domestic shares (%)
2016,2015,2014,2013,2012,2011,2010,2009,2008,2007,2006,2005,2004,2003,2002,2001,2000,1999,1998,1997,1996,1995
This statistics in other country:
Timeline:
This timeline shows a graph from 1995 to 2016 of Europe & Central Asia (IDA & IBRD countries). No data until 1994. Number of actual observations by date: 22.
Source name:
World Development Indicators
Source organization:
World Federation of Exchanges database.
Categories, topics:
Financial Sector
Last updated:
apr 23, 2017
Indicators value changes by year
Maximum:
237.671
jan 1, 1996
At the date of observation
Value
Absolute change
Change from previous value
jan 1, 1995
100.188
+100.188
0.0%
jan 1, 1996
237.671
+137.483
137.23%
jan 1, 1997
102.959
-134.712
-56.68%
jan 1, 1998
65.47
-37.489
-36.41%
jan 1, 1999
130.499
+65.029
99.33%
jan 1, 2000
52.73
-77.769
-59.59%
jan 1, 2001
190.26
+137.53
260.82%
jan 1, 2002
100.132
-90.128
-47.37%
jan 1, 2003
107.246
+7.114
7.1%
jan 1, 2004
83.939
-23.307
-21.73%
jan 1, 2005
87.027
+3.088
3.68%
jan 1, 2006
74.055
-12.972
-14.91%
jan 1, 2007
74.413
+0.358
0.48%
jan 1, 2008
62.667
-11.745
-15.78%
jan 1, 2009
96.913
+34.246
54.65%
jan 1, 2010
74.759
-22.155
-22.86%
jan 1, 2011
63.675
-11.084
-14.83%
jan 1, 2012
83.578
+19.903
31.26%
jan 1, 2013
55.322
-28.255
-33.81%
jan 1, 2014
64.294
+8.972
16.22%
jan 1, 2015
65.575
+1.281
1.99%
jan 1, 2016
71.544
+5.969
9.1%
Ranking of countries by current statistics by years


Comments: