29
/
en
AIzaSyAYiBZKx7MnpbEhh9jyipgxe19OcubqV5w
April 1, 2024
148623
Guyana
GUY
true
2
1
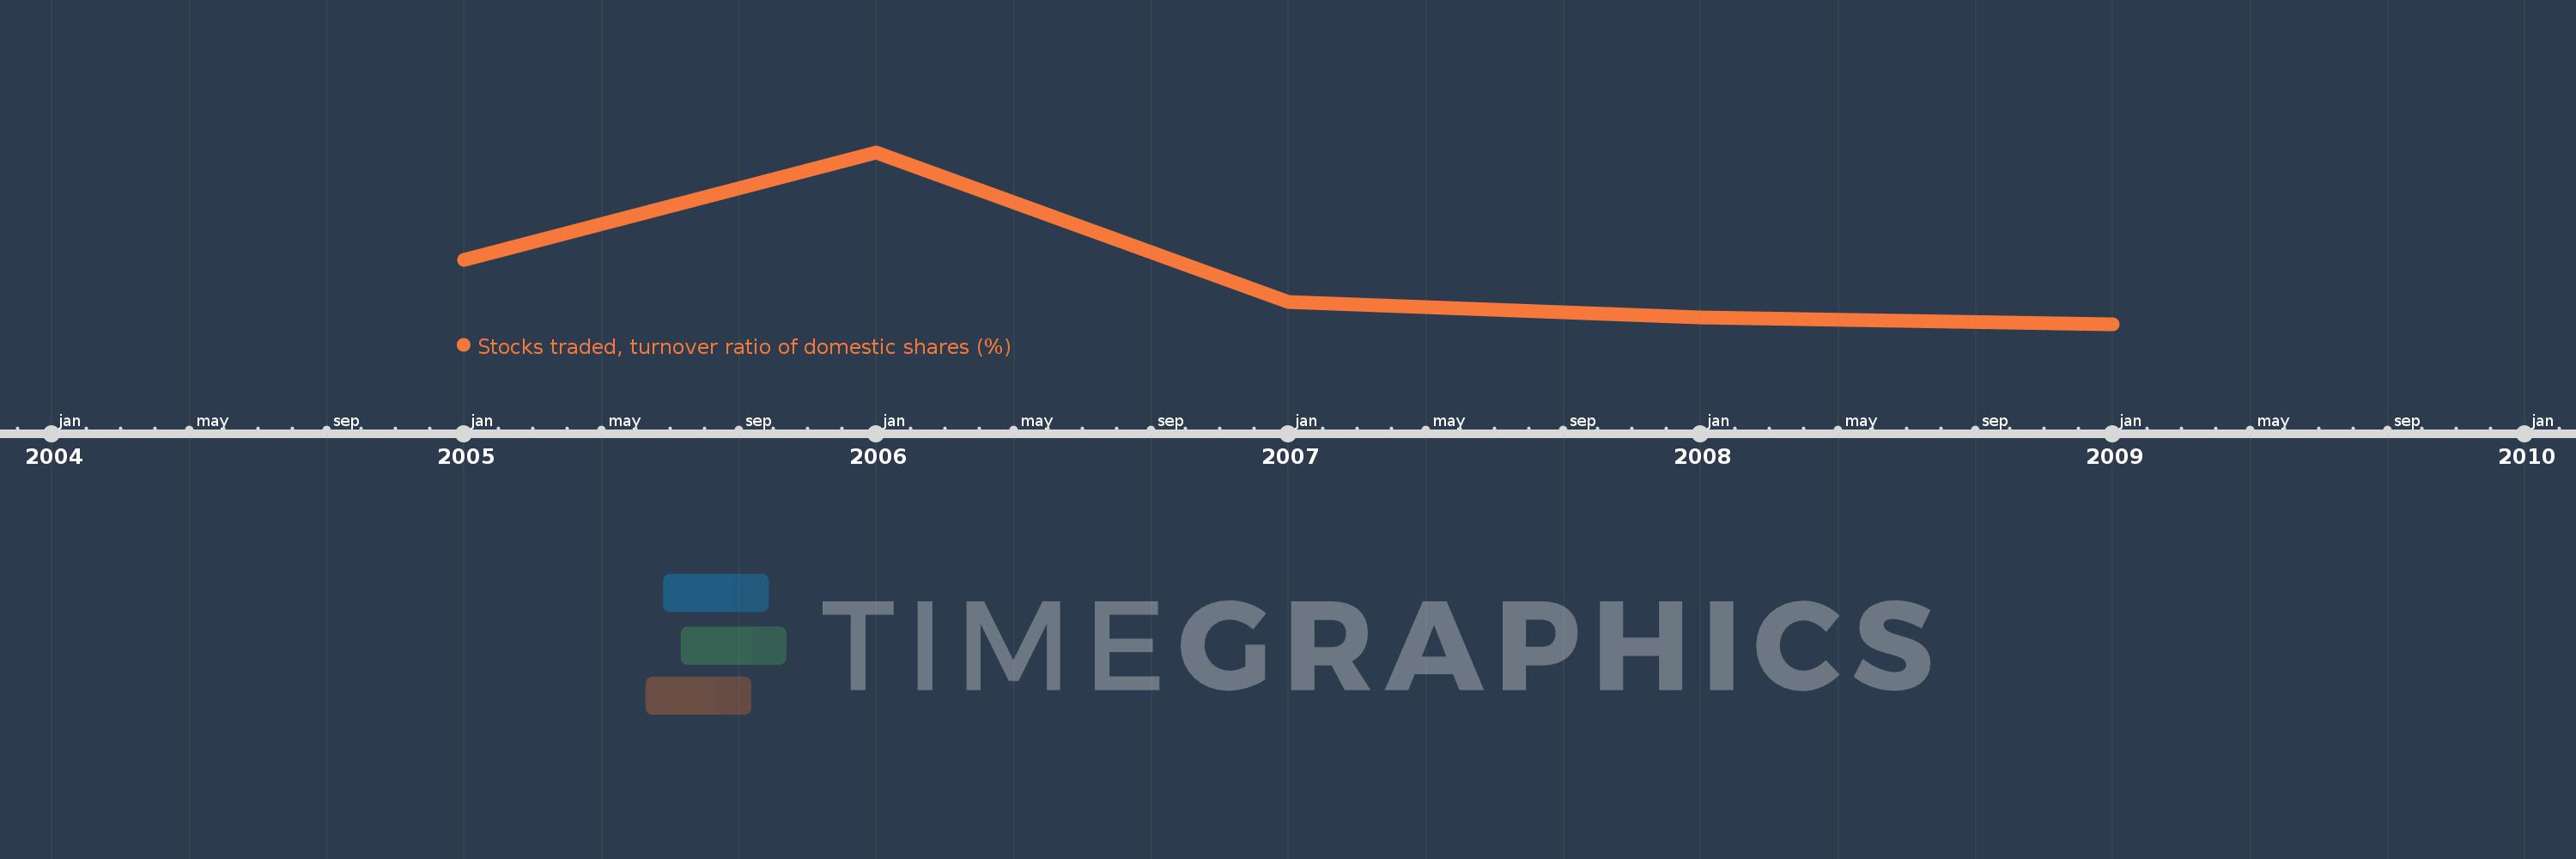
Stocks traded, turnover ratio of domestic shares (%)
2009,2008,2007,2006,2005
This statistics in other country:
Timeline:
This timeline shows a graph from 2005 to 2009 of Guyana. No data until 2004. Number of actual observations by date: 5.
Source name:
World Development Indicators
Source organization:
World Federation of Exchanges database.
Categories, topics:
Financial Sector
Last updated:
apr 23, 2017
Indicators value changes by year
At the date of observation
Value
Absolute change
Change from previous value
jan 1, 2005
1.12
+1.12
0.0%
jan 1, 2006
2.552
+1.432
127.92%
jan 1, 2007
0.555
-1.997
-78.25%
jan 1, 2008
0.36
-0.195
-35.16%
jan 1, 2009
0.264
-0.095
-26.53%
Ranking of countries by current statistics by years


Comments: