29
/
en
AIzaSyAYiBZKx7MnpbEhh9jyipgxe19OcubqV5w
April 1, 2024
235166
Saudi Arabia
SAU
true
2
1
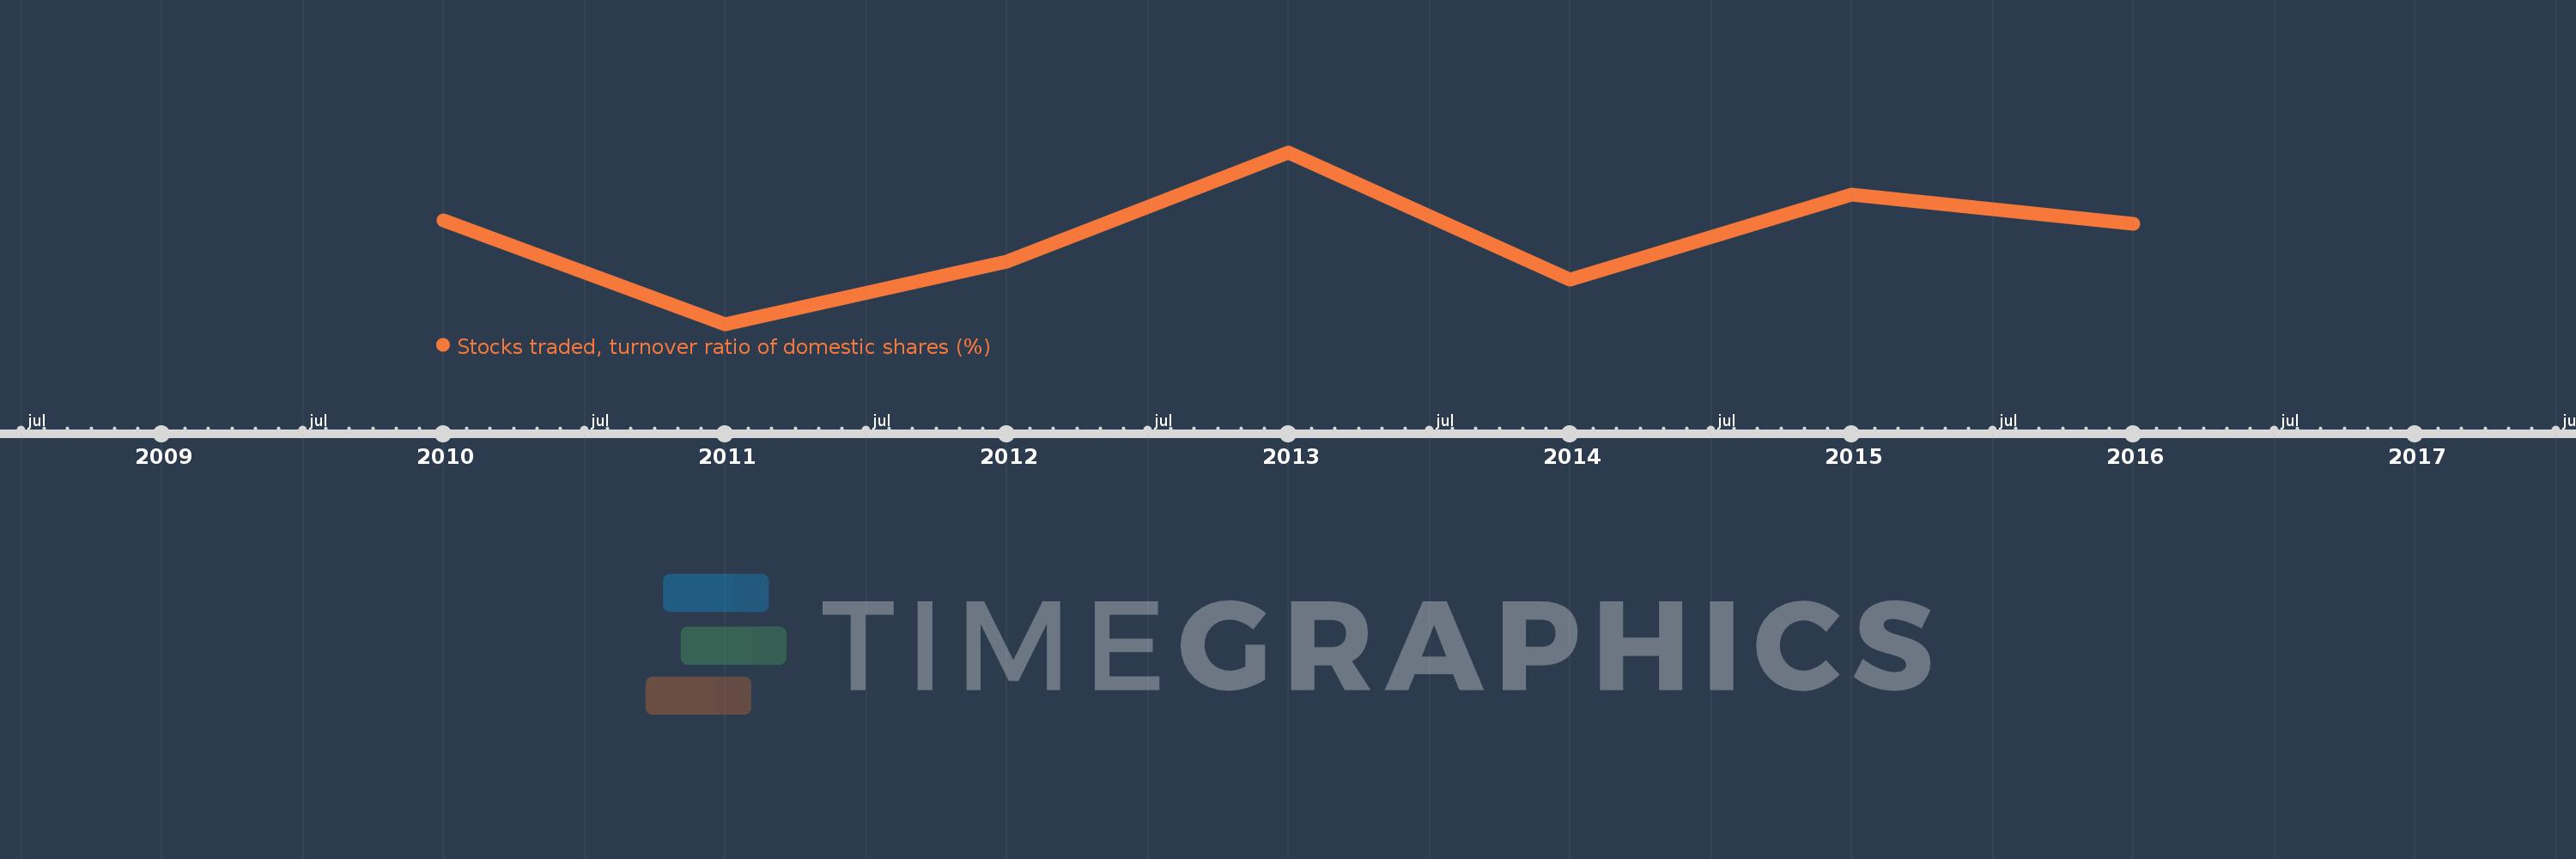
Stocks traded, turnover ratio of domestic shares (%)
2016,2015,2014,2013,2012,2011,2010
This statistics in other country:
Timeline:
This timeline shows a graph from 2010 to 2016 of Saudi Arabia. No data until 2009. Number of actual observations by date: 7.
Source name:
World Development Indicators
Source organization:
World Federation of Exchanges database.
Categories, topics:
Financial Sector
Last updated:
apr 23, 2017
Indicators value changes by year
Minimum:
56.934
jan 1, 2011
Maximum:
136.908
jan 1, 2013
At the date of observation
Value
Absolute change
Change from previous value
jan 1, 2010
105.138
+105.138
0.0%
jan 1, 2011
56.934
-48.204
-45.85%
jan 1, 2012
86.001
+29.067
51.05%
jan 1, 2013
136.908
+50.906
59.19%
jan 1, 2014
77.541
-59.366
-43.36%
jan 1, 2015
117.444
+39.903
51.46%
jan 1, 2016
103.772
-13.673
-11.64%
Ranking of countries by current statistics by years


Comments: