29
/
en
AIzaSyAYiBZKx7MnpbEhh9jyipgxe19OcubqV5w
April 1, 2024
54445
Pacific island small states
PSS
false
2
1
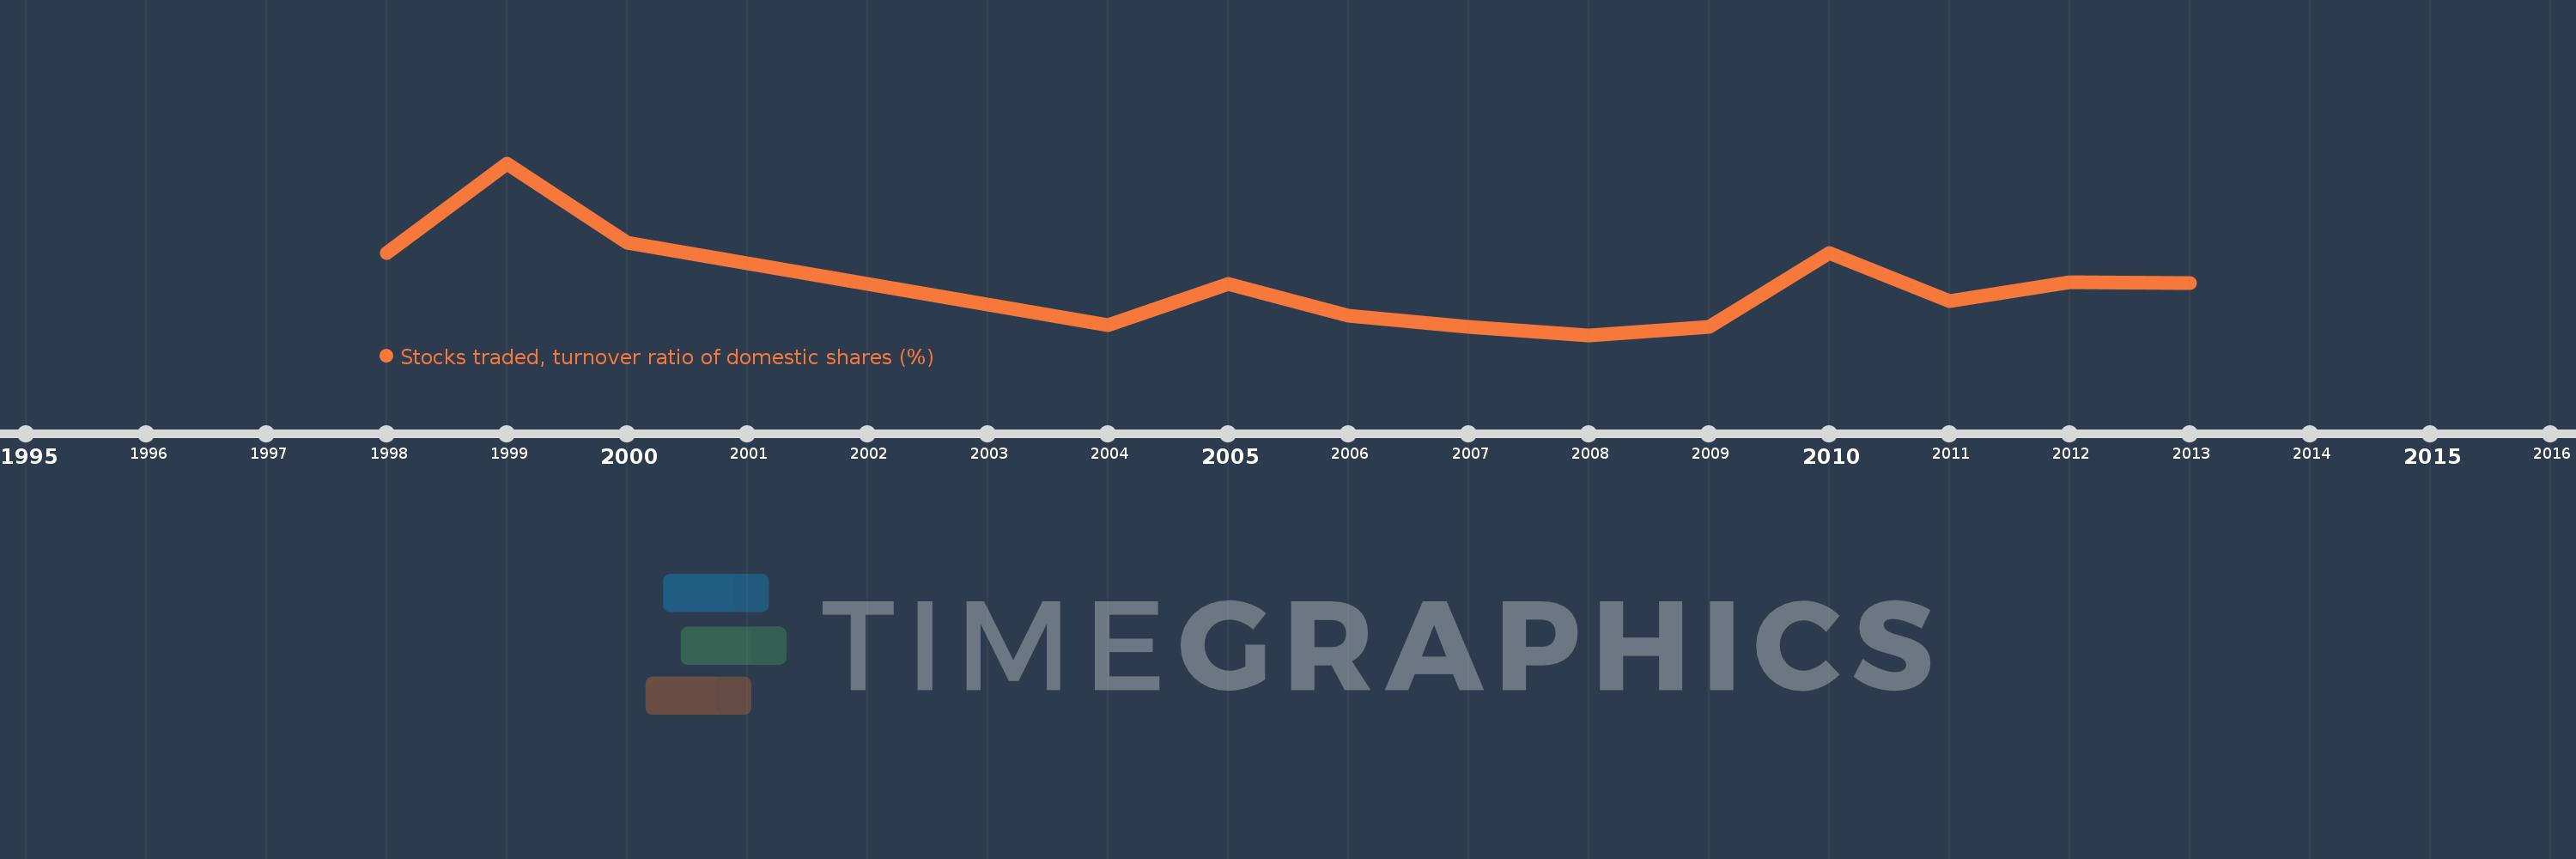
Stocks traded, turnover ratio of domestic shares (%)
2013,2012,2011,2010,2009,2008,2007,2006,2005,2004,2000,1999,1998
This statistics in other country:
Timeline:
This timeline shows a graph from 1998 to 2013 of Pacific island small states. No data until 1997. Number of actual observations by date: 13.
Source name:
World Development Indicators
Source organization:
World Federation of Exchanges database.
Categories, topics:
Financial Sector
Last updated:
apr 23, 2017
Indicators value changes by year
At the date of observation
Value
Absolute change
Change from previous value
jan 1, 1998
2.286
+2.286
0.0%
jan 1, 1999
4.42
+2.134
93.37%
jan 1, 2000
2.544
-1.876
-42.44%
jan 1, 2004
0.571
-1.973
-77.54%
jan 1, 2005
1.55
+0.979
171.32%
jan 1, 2006
0.795
-0.755
-48.7%
jan 1, 2007
0.534
-0.262
-32.89%
jan 1, 2008
0.345
-0.188
-35.31%
jan 1, 2009
0.53
+0.185
53.56%
jan 1, 2010
2.295
+1.765
333.07%
jan 1, 2011
1.154
-1.142
-49.74%
jan 1, 2012
1.589
+0.435
37.72%
jan 1, 2013
1.568
-0.021
-1.31%
Ranking of countries by current statistics by years


Comments: