29
/
en
AIzaSyAYiBZKx7MnpbEhh9jyipgxe19OcubqV5w
April 1, 2024
287941
Zimbabwe
ZWE
true
2
1
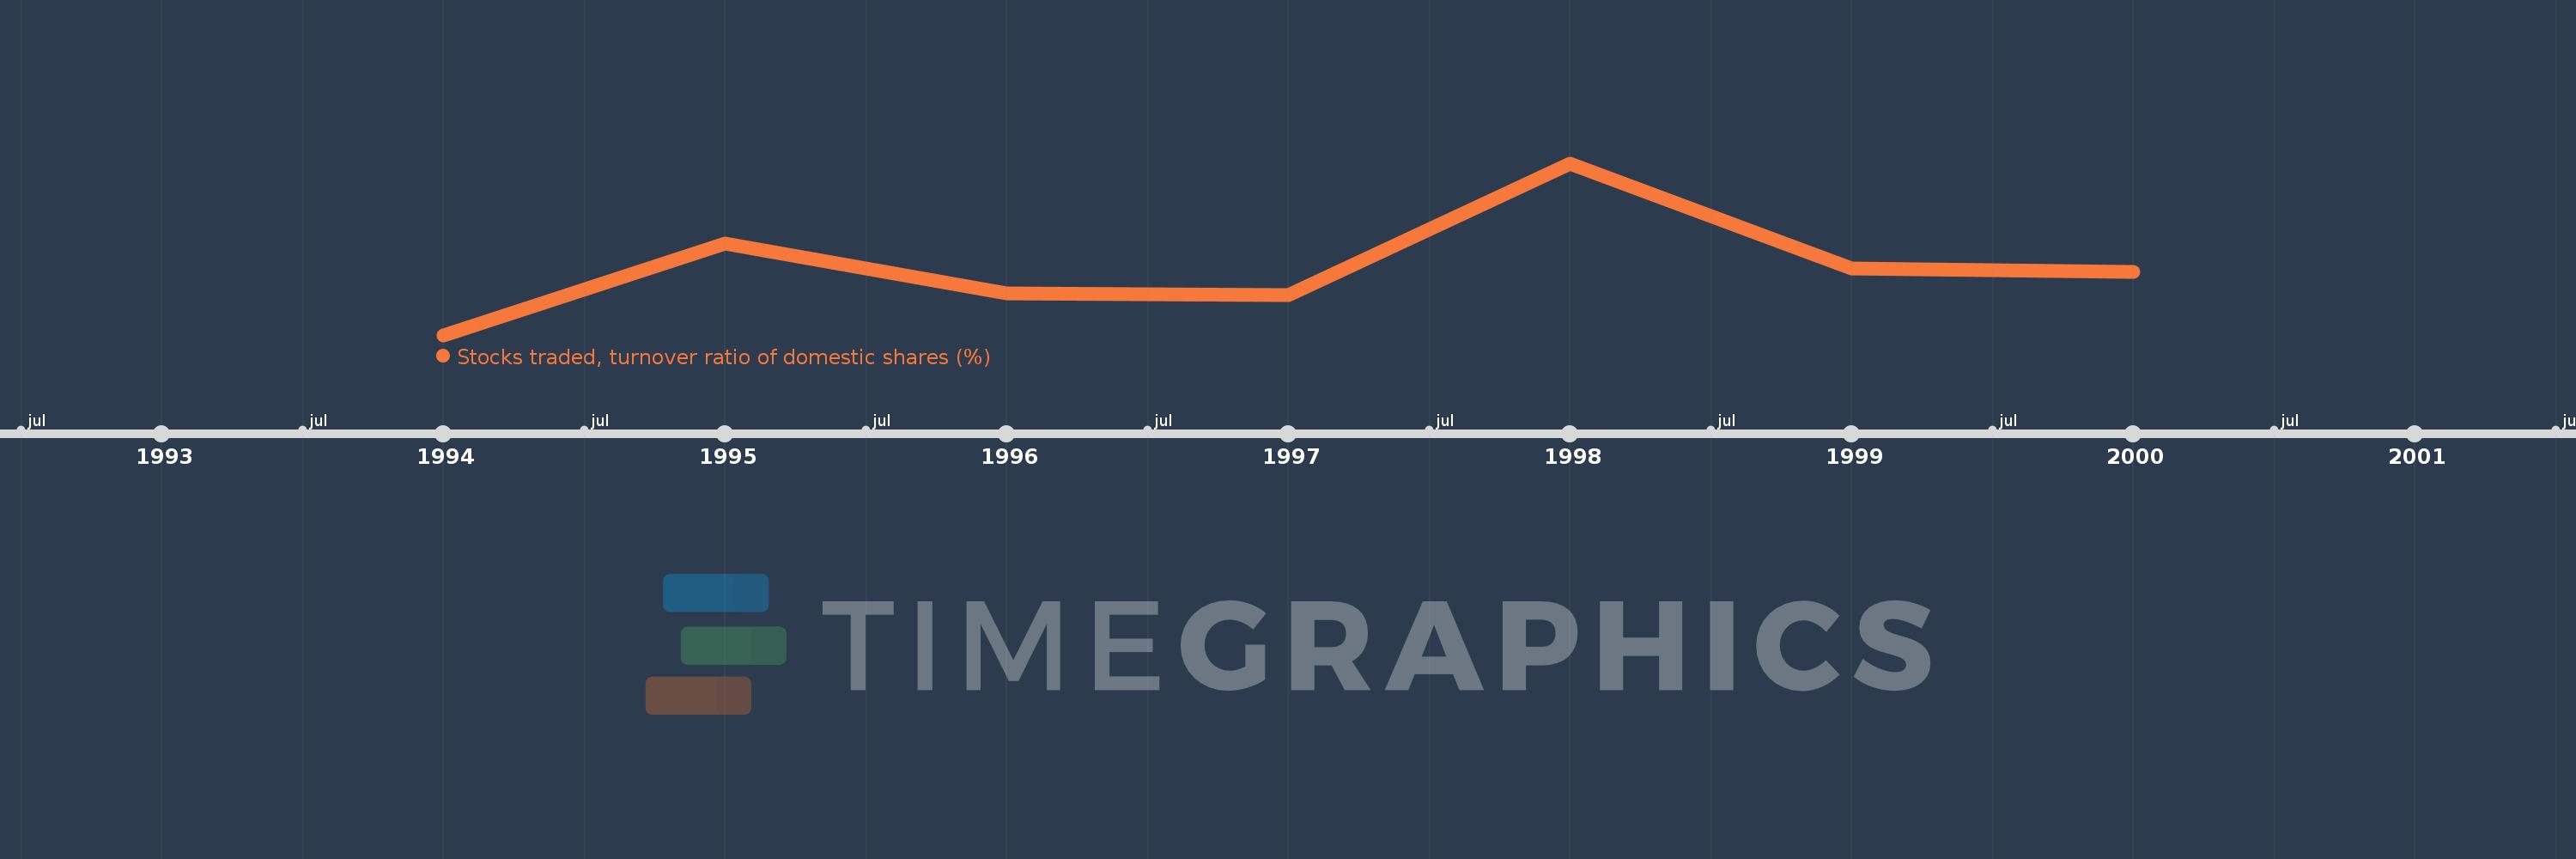
Stocks traded, turnover ratio of domestic shares (%)
2000,1999,1998,1997,1996,1995,1994
This statistics in other country:
Timeline:
This timeline shows a graph from 1994 to 2000 of Zimbabwe. No data until 1993. Number of actual observations by date: 7.
Source name:
World Development Indicators
Source organization:
World Federation of Exchanges database.
Categories, topics:
Financial Sector
Last updated:
apr 23, 2017
Indicators value changes by year
Maximum:
16.217
jan 1, 1998
At the date of observation
Value
Absolute change
Change from previous value
jan 1, 1994
3.491
+3.491
0.0%
jan 1, 1995
10.261
+6.769
193.9%
jan 1, 1996
6.546
-3.714
-36.2%
jan 1, 1997
6.444
-0.102
-1.55%
jan 1, 1998
16.217
+9.772
151.64%
jan 1, 1999
8.395
-7.822
-48.24%
jan 1, 2000
8.175
-0.22
-2.62%
Ranking of countries by current statistics by years


Comments: