29
/it/
it
AIzaSyAYiBZKx7MnpbEhh9jyipgxe19OcubqV5w
April 1, 2024
70106
Argentina
ARG
true
2
1
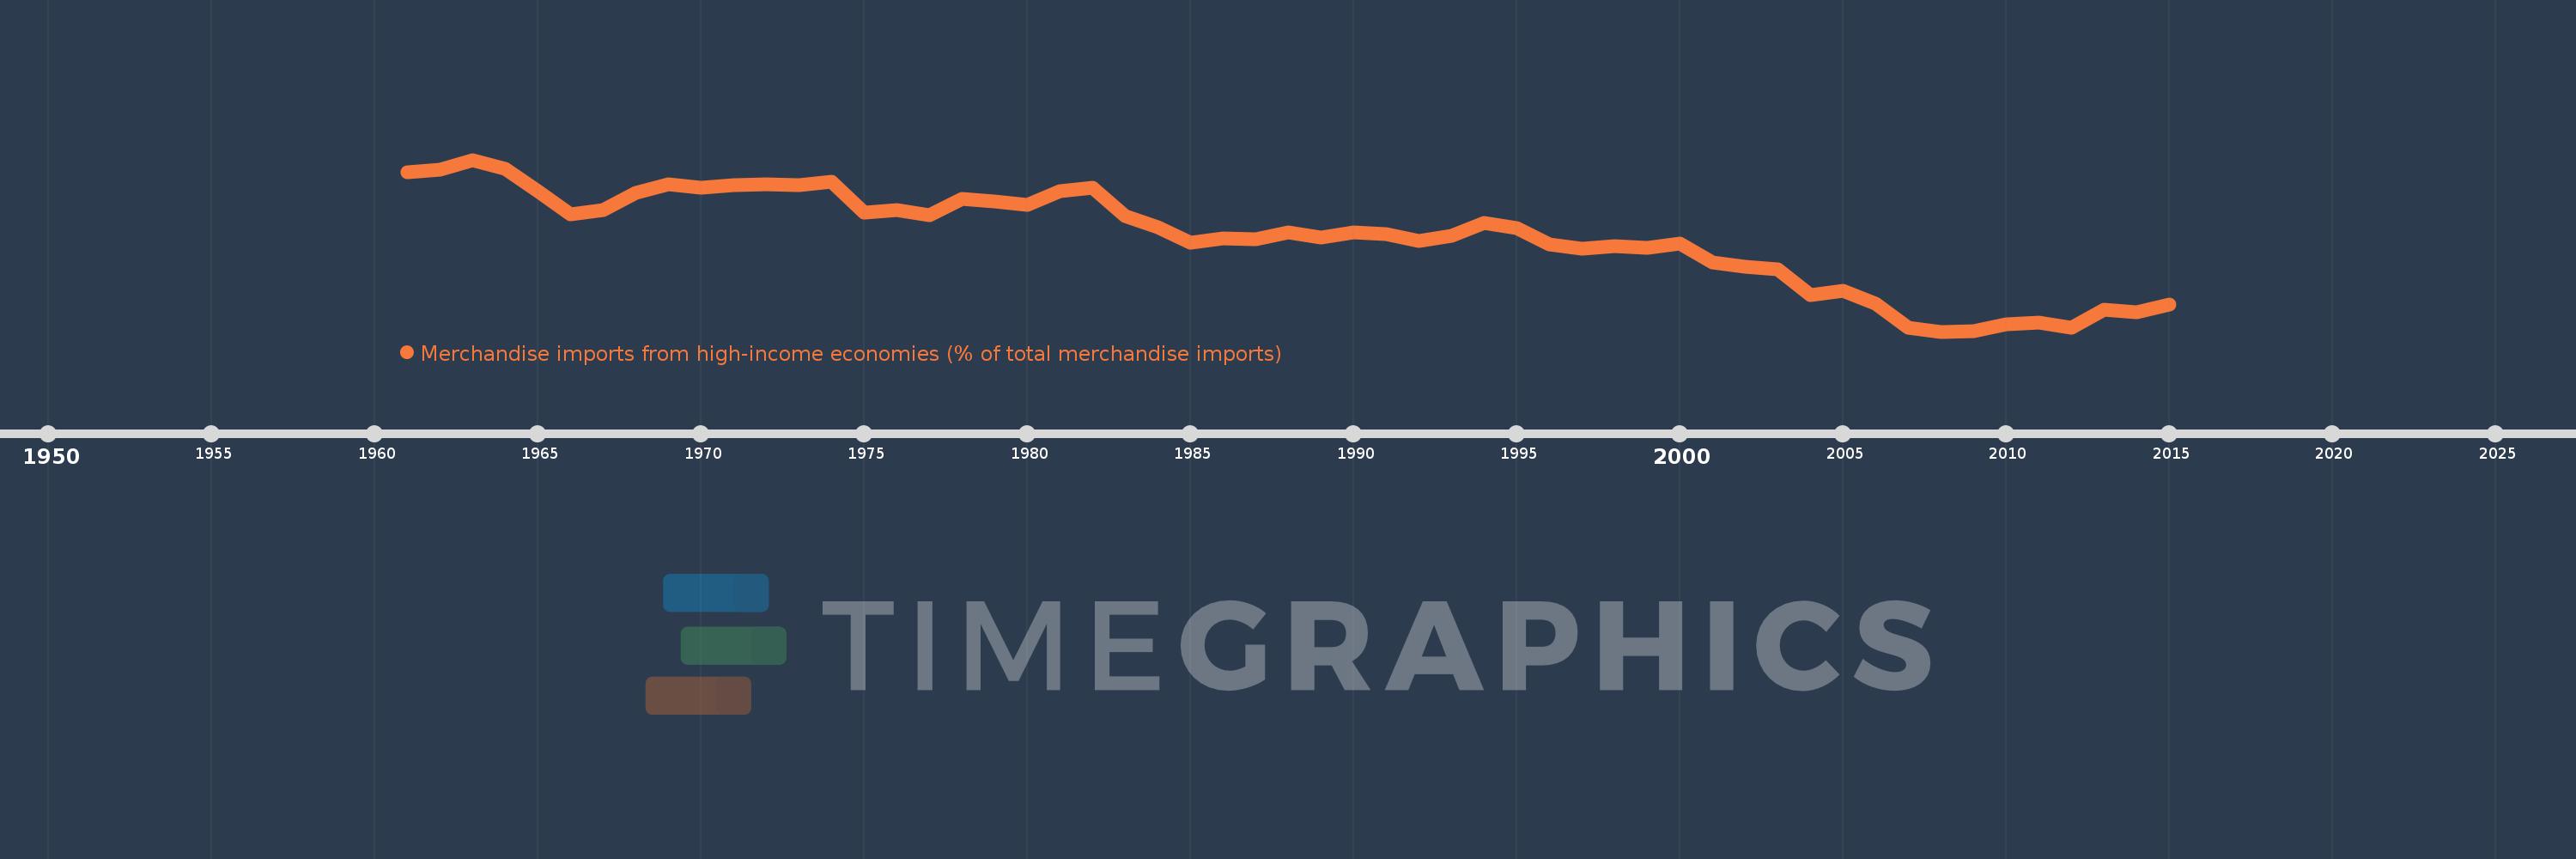
Merchandise imports from high-income economies (% of total merchandise imports)
2015,2014,2013,2012,2011,2010,2009,2008,2007,2006,2005,2004,2003,2002,2001,2000,1999,1998,1997,1996,1995,1994,1993,1992,1991,1990,1989,1988,1987,1986,1985,1984,1983,1982,1981,1980,1979,1978,1977,1976,1975,1974,1973,1972,1971,1970,1969,1968,1967,1966,1965,1964,1963,1962,1961
Queste statistiche in altri paesi:
AfghanistanAlbaniaAlgeriaAngolaAntigua and BarbudaArab WorldArgentinaArmeniaArubaAustraliaAustriaAzerbaijanBahamas, TheBahrainBangladeshBarbadosBelarusBelgiumBelizeBeninBermudaBoliviaBosnia and HerzegovinaBrazilBrunei DarussalamBulgariaBurkina FasoBurundiCabo VerdeCambodiaCameroonCanadaCaribbean small statesCentral African RepublicCentral Europe and the BalticsChadChileChinaColombiaComorosCongo, Dem. Rep.Congo, Rep.Costa RicaCote d'IvoireCroatiaCubaCyprusCzech RepublicDenmarkDjiboutiDominicaDominican RepublicEarly-demographic dividendEast Asia & PacificEast Asia & Pacific (excluding high income)East Asia & Pacific (IDA & IBRD countries)EcuadorEgypt, Arab Rep.El SalvadorEquatorial GuineaEstoniaEthiopiaEuro areaEurope & Central AsiaEurope & Central Asia (excluding high income)Europe & Central Asia (IDA & IBRD countries)European UnionFaroe IslandsFijiFinlandFragile and conflict affected situationsFranceFrench PolynesiaGabonGambia, TheGeorgiaGermanyGhanaGibraltarGreeceGreenlandGrenadaGuamGuatemalaGuineaGuinea-BissauGuyanaHaitiHeavily indebted poor countries (HIPC)High incomeHondurasHong Kong SAR, ChinaHungaryIBRD onlyIcelandIDA & IBRD totalIDA blendIDA onlyIDA totalIndiaIndonesiaIran, Islamic Rep.IraqIrelandIsraelItalyJamaicaJapanJordanKazakhstanKenyaKiribatiKorea, Dem. People’s Rep.Korea, Rep.KosovoKuwaitKyrgyz RepublicLao PDRLate-demographic dividendLatin America & Caribbean Latin America & Caribbean (excluding high income)Latin America & the Caribbean (IDA & IBRD countries)LatviaLeast developed countries: UN classificationLebanonLiberiaLibyaLithuaniaLow & middle incomeLow incomeLower middle incomeLuxembourgMacao SAR, ChinaMacedonia, FYRMadagascarMalawiMalaysiaMaldivesMaliMaltaMauritaniaMauritiusMexicoMiddle East & North AfricaMiddle East & North Africa (excluding high income)Middle East & North Africa (IDA & IBRD countries)Middle incomeMoldovaMongoliaMontenegroMoroccoMozambiqueMyanmarNauruNepalNetherlandsNew CaledoniaNew ZealandNicaraguaNigerNigeriaNorth AmericaNorwayOECD membersOmanOther small statesPacific island small statesPakistanPanamaPapua New GuineaParaguayPeruPhilippinesPolandPortugalPost-demographic dividendPre-demographic dividendQatarRomaniaRussian FederationRwandaSamoaSao Tome and PrincipeSaudi ArabiaSenegalSerbiaSeychellesSierra LeoneSingaporeSlovak RepublicSloveniaSmall statesSolomon IslandsSomaliaSouth AfricaSouth AsiaSouth Asia (IDA & IBRD)SpainSri LankaSt. Kitts and NevisSt. LuciaSt. Vincent and the GrenadinesSub-Saharan Africa Sub-Saharan Africa (excluding high income)Sub-Saharan Africa (IDA & IBRD countries)SudanSurinameSwedenSwitzerlandSyrian Arab RepublicTajikistanTanzaniaThailandTogoTongaTrinidad and TobagoTunisiaTurkeyTurkmenistanTuvaluUgandaUkraineUnited Arab EmiratesUnited KingdomUnited StatesUpper middle incomeUruguayUzbekistanVanuatuVenezuela, RBVietnamWorldYemen, Rep.ZambiaZimbabwe Linea del tempo:
Questa scala temporale mostra un grafico dal 1961 anno al 2015 anno. Argentina. I dati fino ad 1960 anno non disponibili. Il numero di osservazioni attuali secondo i date: 55.
La fonte (nome):
Indicatori dello sviluppo mondiale
La fonte (organizzazione):
World Bank staff estimates based data from International Monetary Fund's Direction of Trade database.
Categorie:
Private Sector, Trade
sono stati aggiornati
23 apr 2017 anni
Indicatori delle variazioni dei valori per anni
Minima:
39.388
1 gen 2008 anni
Massimo:
86.705
1 gen 1963 anni
Alla data di osservazione
Valore
Variazione assoluta
La variazione rispetto al valore precedente
1 gen 1961 anni
83.248
+83.248
0.0%
1 gen 1962 anni
83.922
+0.674
0.81%
1 gen 1963 anni
86.705
+2.783
3.32%
1 gen 1964 anni
84.113
-2.592
-2.99%
1 gen 1965 anni
78.149
-5.964
-7.09%
1 gen 1966 anni
71.766
-6.383
-8.17%
1 gen 1967 anni
72.79
+1.025
1.43%
1 gen 1968 anni
77.629
+4.838
6.65%
1 gen 1969 anni
79.856
+2.228
2.87%
1 gen 1970 anni
78.952
-0.904
-1.13%
1 gen 1971 anni
79.776
+0.824
1.04%
1 gen 1972 anni
80.034
+0.258
0.32%
1 gen 1973 anni
79.646
-0.388
-0.48%
1 gen 1974 anni
80.698
+1.052
1.32%
1 gen 1975 anni
72.247
-8.451
-10.47%
1 gen 1976 anni
72.976
+0.729
1.01%
1 gen 1977 anni
71.489
-1.487
-2.04%
1 gen 1978 anni
75.881
+4.392
6.14%
1 gen 1979 anni
75.258
-0.623
-0.82%
1 gen 1980 anni
74.372
-0.886
-1.18%
1 gen 1981 anni
77.959
+3.586
4.82%
1 gen 1982 anni
79.028
+1.07
1.37%
1 gen 1983 anni
71.216
-7.812
-9.89%
1 gen 1984 anni
68.239
-2.977
-4.18%
1 gen 1985 anni
63.787
-4.452
-6.52%
1 gen 1986 anni
65.011
+1.224
1.92%
1 gen 1987 anni
64.87
-0.141
-0.22%
1 gen 1988 anni
66.651
+1.781
2.75%
1 gen 1989 anni
65.305
-1.346
-2.02%
1 gen 1990 anni
66.77
+1.466
2.24%
1 gen 1991 anni
66.358
-0.413
-0.62%
1 gen 1992 anni
64.441
-1.917
-2.89%
1 gen 1993 anni
65.651
+1.21
1.88%
1 gen 1994 anni
69.285
+3.634
5.54%
1 gen 1995 anni
67.875
-1.41
-2.03%
1 gen 1996 anni
63.355
-4.52
-6.66%
1 gen 1997 anni
62.212
-1.143
-1.8%
1 gen 1998 anni
62.947
+0.735
1.18%
1 gen 1999 anni
62.479
-0.468
-0.74%
1 gen 2000 anni
63.566
+1.087
1.74%
1 gen 2001 anni
58.338
-5.228
-8.22%
1 gen 2002 anni
57.135
-1.203
-2.06%
1 gen 2003 anni
56.465
-0.67
-1.17%
1 gen 2004 anni
49.558
-6.907
-12.23%
1 gen 2005 anni
50.612
+1.054
2.13%
1 gen 2006 anni
47.072
-3.539
-6.99%
1 gen 2007 anni
40.538
-6.535
-13.88%
1 gen 2008 anni
39.388
-1.15
-2.84%
1 gen 2009 anni
39.498
+0.11
0.28%
1 gen 2010 anni
41.492
+1.994
5.05%
1 gen 2011 anni
41.96
+0.468
1.13%
1 gen 2012 anni
40.375
-1.585
-3.78%
1 gen 2013 anni
45.329
+4.954
12.27%
1 gen 2014 anni
44.661
-0.668
-1.47%
1 gen 2015 anni
46.944
+2.283
5.11%
Classificazione dei paesi secondo i statistiche attuali per anni


Commenti: