29
/it/
it
AIzaSyAYiBZKx7MnpbEhh9jyipgxe19OcubqV5w
April 1, 2024
238481
Seychelles
SYC
true
2
1
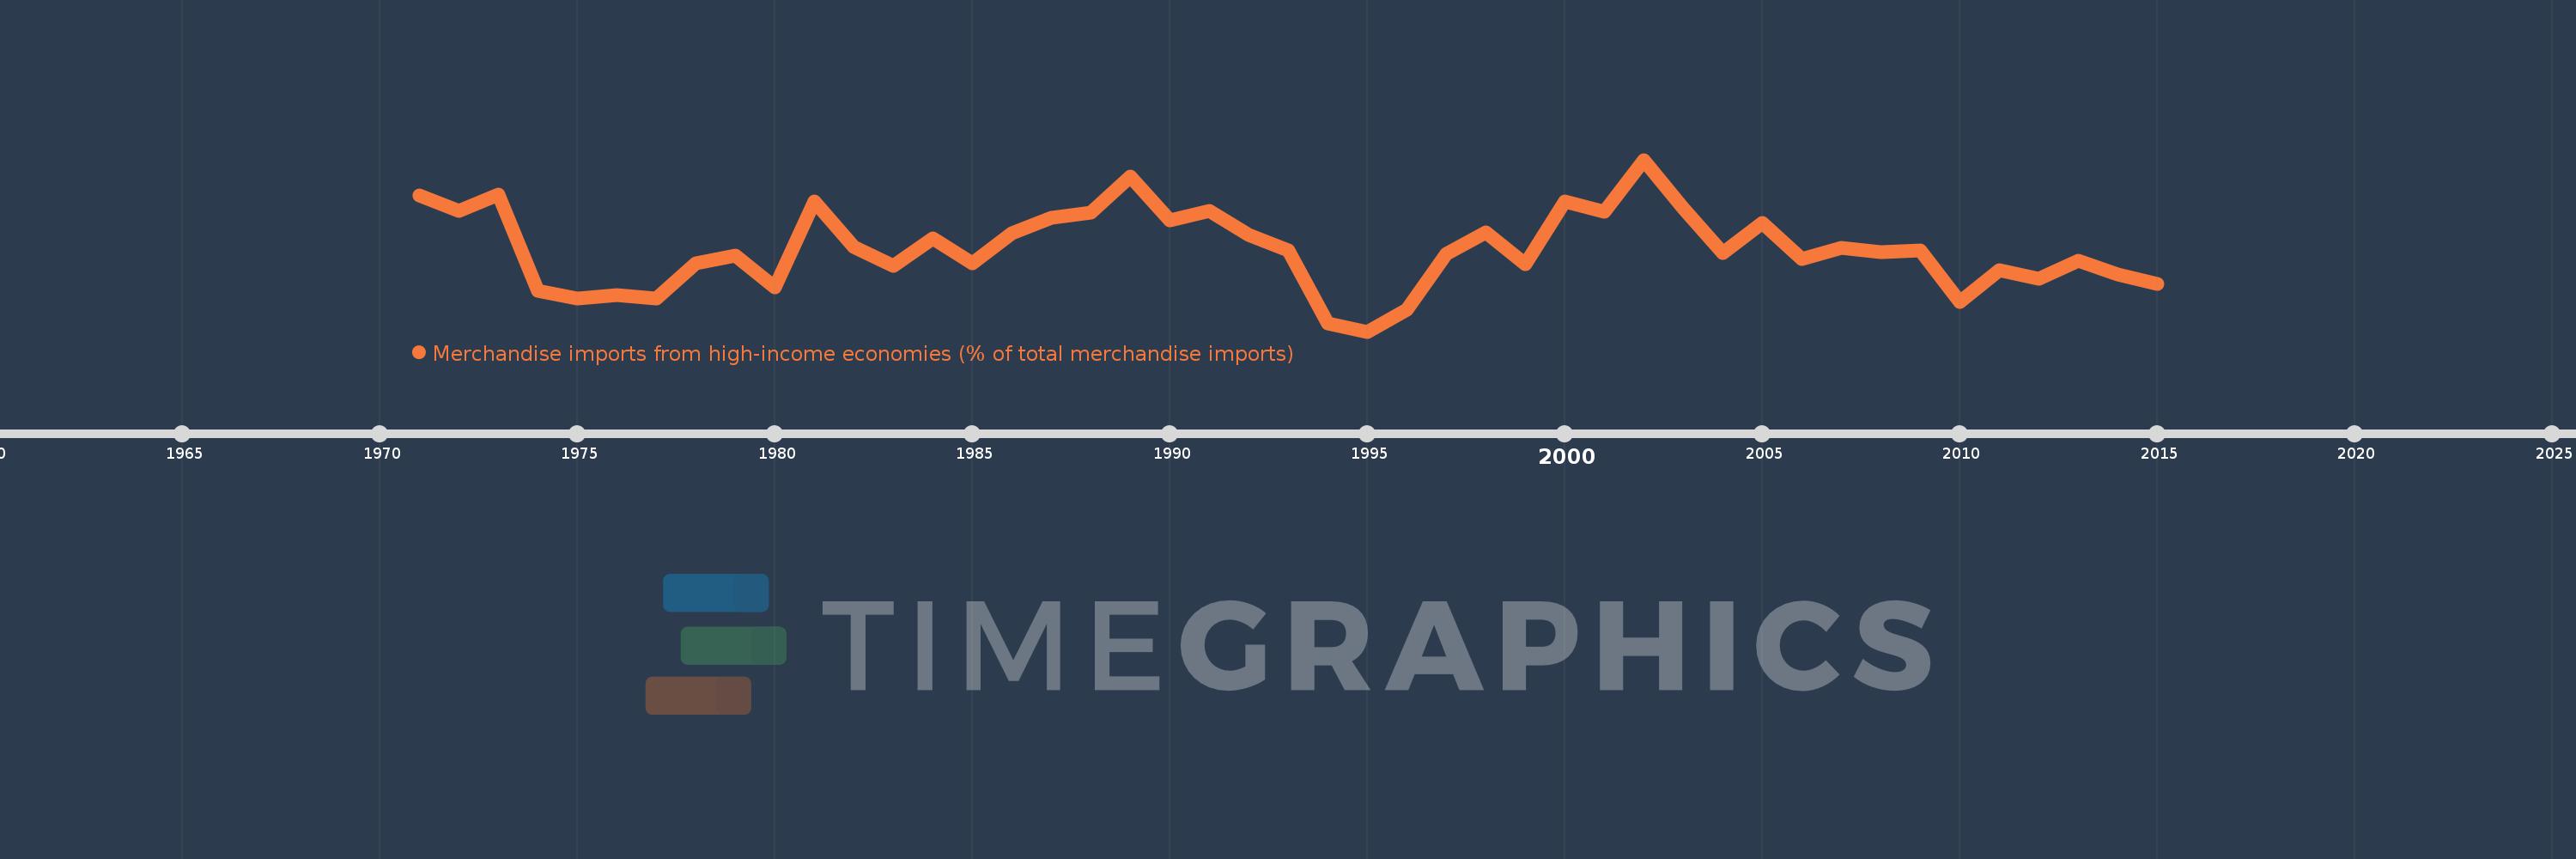
Merchandise imports from high-income economies (% of total merchandise imports)
2015,2014,2013,2012,2011,2010,2009,2008,2007,2006,2005,2004,2003,2002,2001,2000,1999,1998,1997,1996,1995,1994,1993,1992,1991,1990,1989,1988,1987,1986,1985,1984,1983,1982,1981,1980,1979,1978,1977,1976,1975,1974,1973,1972,1971
Queste statistiche in altri paesi:
AfghanistanAlbaniaAlgeriaAngolaAntigua and BarbudaArab WorldArgentinaArmeniaArubaAustraliaAustriaAzerbaijanBahamas, TheBahrainBangladeshBarbadosBelarusBelgiumBelizeBeninBermudaBoliviaBosnia and HerzegovinaBrazilBrunei DarussalamBulgariaBurkina FasoBurundiCabo VerdeCambodiaCameroonCanadaCaribbean small statesCentral African RepublicCentral Europe and the BalticsChadChileChinaColombiaComorosCongo, Dem. Rep.Congo, Rep.Costa RicaCote d'IvoireCroatiaCubaCyprusCzech RepublicDenmarkDjiboutiDominicaDominican RepublicEarly-demographic dividendEast Asia & PacificEast Asia & Pacific (excluding high income)East Asia & Pacific (IDA & IBRD countries)EcuadorEgypt, Arab Rep.El SalvadorEquatorial GuineaEstoniaEthiopiaEuro areaEurope & Central AsiaEurope & Central Asia (excluding high income)Europe & Central Asia (IDA & IBRD countries)European UnionFaroe IslandsFijiFinlandFragile and conflict affected situationsFranceFrench PolynesiaGabonGambia, TheGeorgiaGermanyGhanaGibraltarGreeceGreenlandGrenadaGuamGuatemalaGuineaGuinea-BissauGuyanaHaitiHeavily indebted poor countries (HIPC)High incomeHondurasHong Kong SAR, ChinaHungaryIBRD onlyIcelandIDA & IBRD totalIDA blendIDA onlyIDA totalIndiaIndonesiaIran, Islamic Rep.IraqIrelandIsraelItalyJamaicaJapanJordanKazakhstanKenyaKiribatiKorea, Dem. People’s Rep.Korea, Rep.KosovoKuwaitKyrgyz RepublicLao PDRLate-demographic dividendLatin America & Caribbean Latin America & Caribbean (excluding high income)Latin America & the Caribbean (IDA & IBRD countries)LatviaLeast developed countries: UN classificationLebanonLiberiaLibyaLithuaniaLow & middle incomeLow incomeLower middle incomeLuxembourgMacao SAR, ChinaMacedonia, FYRMadagascarMalawiMalaysiaMaldivesMaliMaltaMauritaniaMauritiusMexicoMiddle East & North AfricaMiddle East & North Africa (excluding high income)Middle East & North Africa (IDA & IBRD countries)Middle incomeMoldovaMongoliaMontenegroMoroccoMozambiqueMyanmarNauruNepalNetherlandsNew CaledoniaNew ZealandNicaraguaNigerNigeriaNorth AmericaNorwayOECD membersOmanOther small statesPacific island small statesPakistanPanamaPapua New GuineaParaguayPeruPhilippinesPolandPortugalPost-demographic dividendPre-demographic dividendQatarRomaniaRussian FederationRwandaSamoaSao Tome and PrincipeSaudi ArabiaSenegalSerbiaSeychellesSierra LeoneSingaporeSlovak RepublicSloveniaSmall statesSolomon IslandsSomaliaSouth AfricaSouth AsiaSouth Asia (IDA & IBRD)SpainSri LankaSt. Kitts and NevisSt. LuciaSt. Vincent and the GrenadinesSub-Saharan Africa Sub-Saharan Africa (excluding high income)Sub-Saharan Africa (IDA & IBRD countries)SudanSurinameSwedenSwitzerlandSyrian Arab RepublicTajikistanTanzaniaThailandTogoTongaTrinidad and TobagoTunisiaTurkeyTurkmenistanTuvaluUgandaUkraineUnited Arab EmiratesUnited KingdomUnited StatesUpper middle incomeUruguayUzbekistanVanuatuVenezuela, RBVietnamWorldYemen, Rep.ZambiaZimbabwe Linea del tempo:
Questa scala temporale mostra un grafico dal 1971 anno al 2015 anno. Seychelles. I dati fino ad 1970 anno non disponibili. Il numero di osservazioni attuali secondo i date: 45.
La fonte (nome):
Indicatori dello sviluppo mondiale
La fonte (organizzazione):
World Bank staff estimates based data from International Monetary Fund's Direction of Trade database.
Categorie:
Private Sector, Trade
sono stati aggiornati
23 apr 2017 anni
Indicatori delle variazioni dei valori per anni
Minima:
57.048
1 gen 1995 anni
Massimo:
83.955
1 gen 2002 anni
Alla data di osservazione
Valore
Variazione assoluta
La variazione rispetto al valore precedente
1 gen 1971 anni
78.409
+78.409
0.0%
1 gen 1972 anni
75.887
-2.523
-3.22%
1 gen 1973 anni
78.462
+2.575
3.39%
1 gen 1974 anni
63.415
-15.047
-19.18%
1 gen 1975 anni
62.195
-1.22
-1.92%
1 gen 1976 anni
62.706
+0.511
0.82%
1 gen 1977 anni
62.234
-0.472
-0.75%
1 gen 1978 anni
67.77
+5.536
8.9%
1 gen 1979 anni
69.002
+1.231
1.82%
1 gen 1980 anni
63.919
-5.083
-7.37%
1 gen 1981 anni
77.413
+13.494
21.11%
1 gen 1982 anni
70.354
-7.058
-9.12%
1 gen 1983 anni
67.284
-3.071
-4.36%
1 gen 1984 anni
71.7
+4.416
6.56%
1 gen 1985 anni
67.749
-3.951
-5.51%
1 gen 1986 anni
72.399
+4.65
6.86%
1 gen 1987 anni
74.812
+2.413
3.33%
1 gen 1988 anni
75.633
+0.821
1.1%
1 gen 1989 anni
81.346
+5.713
7.55%
1 gen 1990 anni
74.411
-6.934
-8.52%
1 gen 1991 anni
75.992
+1.581
2.12%
1 gen 1992 anni
72.14
-3.852
-5.07%
1 gen 1993 anni
69.805
-2.335
-3.24%
1 gen 1994 anni
58.357
-11.448
-16.4%
1 gen 1995 anni
57.048
-1.309
-2.24%
1 gen 1996 anni
60.477
+3.429
6.01%
1 gen 1997 anni
69.228
+8.751
14.47%
1 gen 1998 anni
72.544
+3.316
4.79%
1 gen 1999 anni
67.657
-4.887
-6.74%
1 gen 2000 anni
77.45
+9.793
14.47%
1 gen 2001 anni
75.751
-1.699
-2.19%
1 gen 2002 anni
83.955
+8.204
10.83%
1 gen 2003 anni
76.351
-7.603
-9.06%
1 gen 2004 anni
69.305
-7.046
-9.23%
1 gen 2005 anni
74.014
+4.708
6.79%
1 gen 2006 anni
68.349
-5.665
-7.65%
1 gen 2007 anni
70.133
+1.784
2.61%
1 gen 2008 anni
69.471
-0.662
-0.94%
1 gen 2009 anni
69.8
+0.329
0.47%
1 gen 2010 anni
61.683
-8.116
-11.63%
1 gen 2011 anni
66.698
+5.015
8.13%
1 gen 2012 anni
65.361
-1.337
-2.0%
1 gen 2013 anni
68.213
+2.852
4.36%
1 gen 2014 anni
66.008
-2.205
-3.23%
1 gen 2015 anni
64.536
-1.472
-2.23%
Classificazione dei paesi secondo i statistiche attuali per anni


Commenti: