29
/it/
it
AIzaSyAYiBZKx7MnpbEhh9jyipgxe19OcubqV5w
April 1, 2024
180149
Libya
LBY
true
2
1
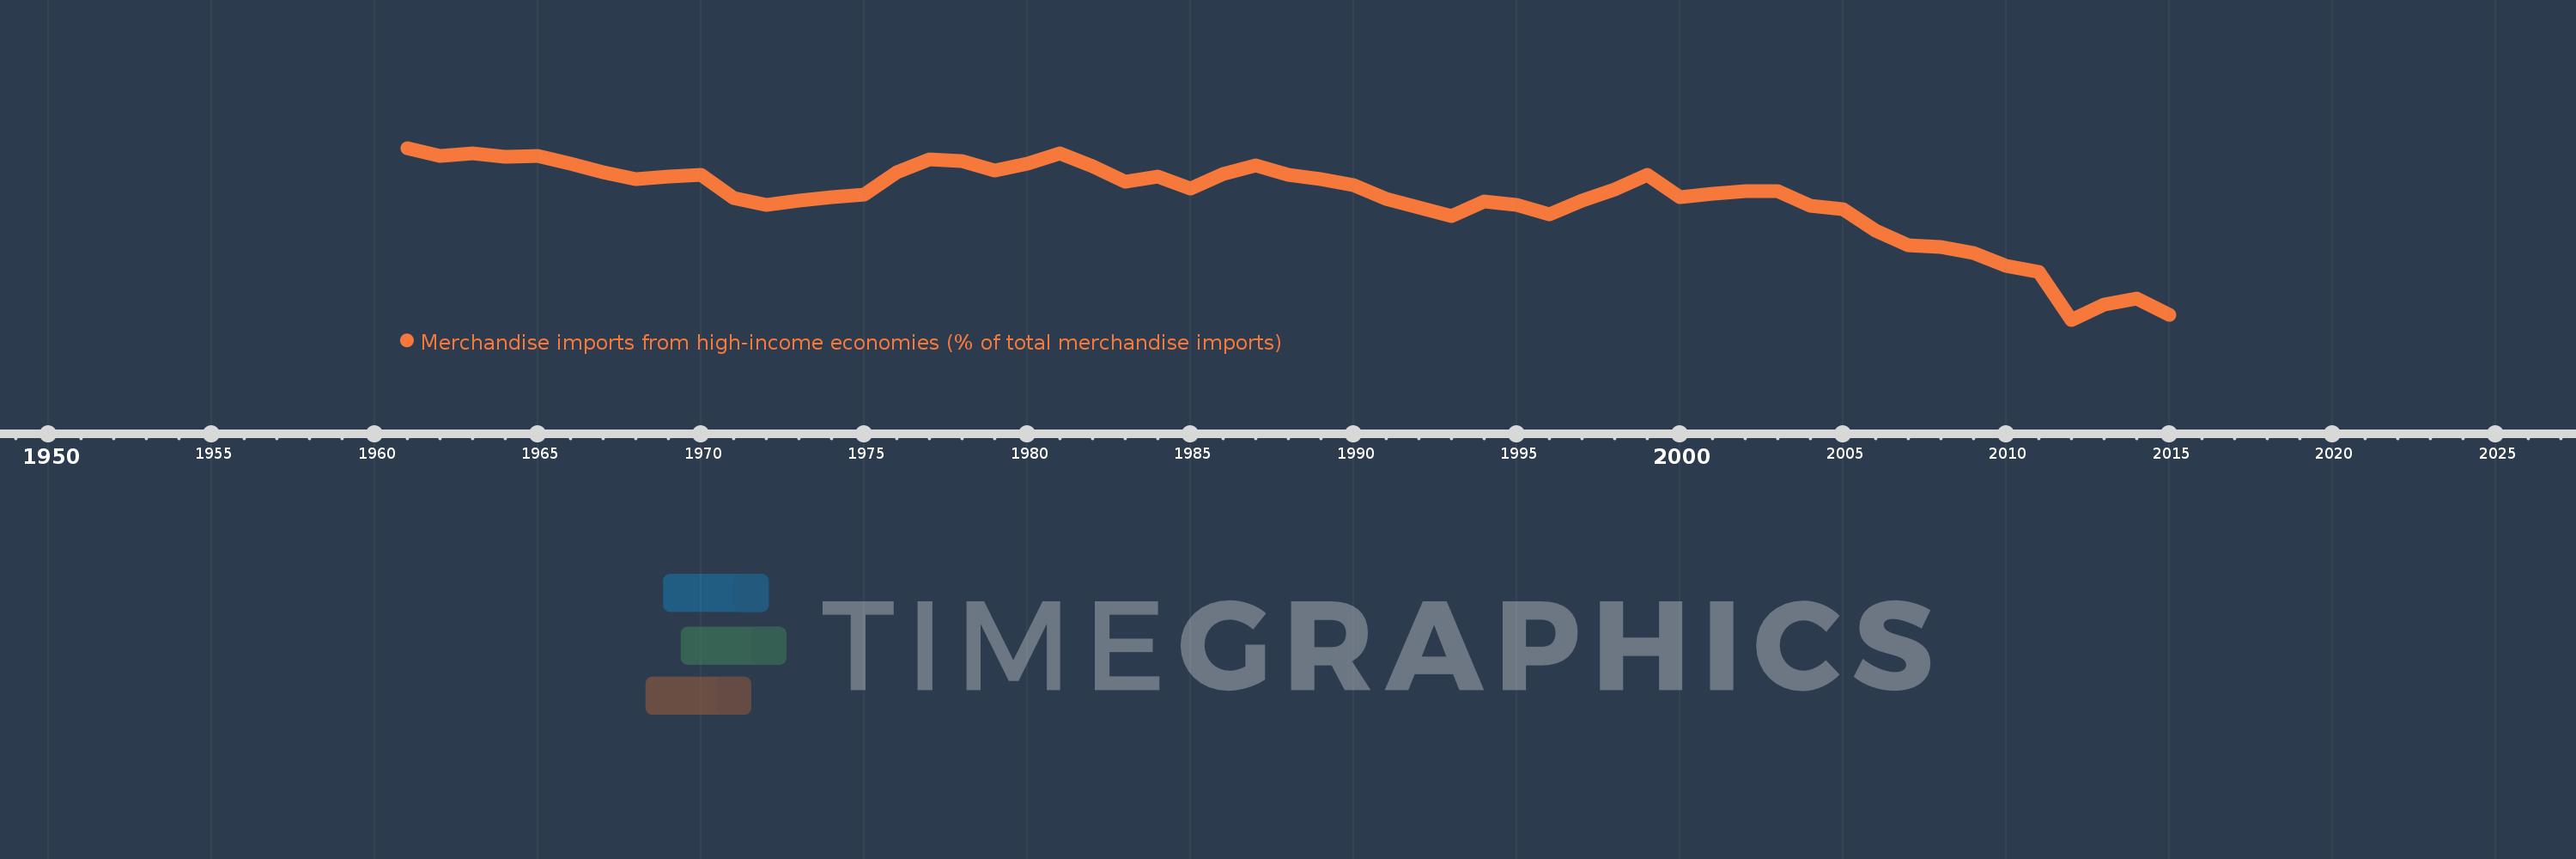
Merchandise imports from high-income economies (% of total merchandise imports)
2015,2014,2013,2012,2011,2010,2009,2008,2007,2006,2005,2004,2003,2002,2001,2000,1999,1998,1997,1996,1995,1994,1993,1992,1991,1990,1989,1988,1987,1986,1985,1984,1983,1982,1981,1980,1979,1978,1977,1976,1975,1974,1973,1972,1971,1970,1969,1968,1967,1966,1965,1964,1963,1962,1961
Queste statistiche in altri paesi:
AfghanistanAlbaniaAlgeriaAngolaAntigua and BarbudaArab WorldArgentinaArmeniaArubaAustraliaAustriaAzerbaijanBahamas, TheBahrainBangladeshBarbadosBelarusBelgiumBelizeBeninBermudaBoliviaBosnia and HerzegovinaBrazilBrunei DarussalamBulgariaBurkina FasoBurundiCabo VerdeCambodiaCameroonCanadaCaribbean small statesCentral African RepublicCentral Europe and the BalticsChadChileChinaColombiaComorosCongo, Dem. Rep.Congo, Rep.Costa RicaCote d'IvoireCroatiaCubaCyprusCzech RepublicDenmarkDjiboutiDominicaDominican RepublicEarly-demographic dividendEast Asia & PacificEast Asia & Pacific (excluding high income)East Asia & Pacific (IDA & IBRD countries)EcuadorEgypt, Arab Rep.El SalvadorEquatorial GuineaEstoniaEthiopiaEuro areaEurope & Central AsiaEurope & Central Asia (excluding high income)Europe & Central Asia (IDA & IBRD countries)European UnionFaroe IslandsFijiFinlandFragile and conflict affected situationsFranceFrench PolynesiaGabonGambia, TheGeorgiaGermanyGhanaGibraltarGreeceGreenlandGrenadaGuamGuatemalaGuineaGuinea-BissauGuyanaHaitiHeavily indebted poor countries (HIPC)High incomeHondurasHong Kong SAR, ChinaHungaryIBRD onlyIcelandIDA & IBRD totalIDA blendIDA onlyIDA totalIndiaIndonesiaIran, Islamic Rep.IraqIrelandIsraelItalyJamaicaJapanJordanKazakhstanKenyaKiribatiKorea, Dem. People’s Rep.Korea, Rep.KosovoKuwaitKyrgyz RepublicLao PDRLate-demographic dividendLatin America & Caribbean Latin America & Caribbean (excluding high income)Latin America & the Caribbean (IDA & IBRD countries)LatviaLeast developed countries: UN classificationLebanonLiberiaLibyaLithuaniaLow & middle incomeLow incomeLower middle incomeLuxembourgMacao SAR, ChinaMacedonia, FYRMadagascarMalawiMalaysiaMaldivesMaliMaltaMauritaniaMauritiusMexicoMiddle East & North AfricaMiddle East & North Africa (excluding high income)Middle East & North Africa (IDA & IBRD countries)Middle incomeMoldovaMongoliaMontenegroMoroccoMozambiqueMyanmarNauruNepalNetherlandsNew CaledoniaNew ZealandNicaraguaNigerNigeriaNorth AmericaNorwayOECD membersOmanOther small statesPacific island small statesPakistanPanamaPapua New GuineaParaguayPeruPhilippinesPolandPortugalPost-demographic dividendPre-demographic dividendQatarRomaniaRussian FederationRwandaSamoaSao Tome and PrincipeSaudi ArabiaSenegalSerbiaSeychellesSierra LeoneSingaporeSlovak RepublicSloveniaSmall statesSolomon IslandsSomaliaSouth AfricaSouth AsiaSouth Asia (IDA & IBRD)SpainSri LankaSt. Kitts and NevisSt. LuciaSt. Vincent and the GrenadinesSub-Saharan Africa Sub-Saharan Africa (excluding high income)Sub-Saharan Africa (IDA & IBRD countries)SudanSurinameSwedenSwitzerlandSyrian Arab RepublicTajikistanTanzaniaThailandTogoTongaTrinidad and TobagoTunisiaTurkeyTurkmenistanTuvaluUgandaUkraineUnited Arab EmiratesUnited KingdomUnited StatesUpper middle incomeUruguayUzbekistanVanuatuVenezuela, RBVietnamWorldYemen, Rep.ZambiaZimbabwe Linea del tempo:
Questa scala temporale mostra un grafico dal 1961 anno al 2015 anno. Libya. I dati fino ad 1960 anno non disponibili. Il numero di osservazioni attuali secondo i date: 55.
La fonte (nome):
Indicatori dello sviluppo mondiale
La fonte (organizzazione):
World Bank staff estimates based data from International Monetary Fund's Direction of Trade database.
Categorie:
Private Sector, Trade
sono stati aggiornati
23 apr 2017 anni
Indicatori delle variazioni dei valori per anni
Minima:
49.303
1 gen 2012 anni
Massimo:
90.848
1 gen 1961 anni
Alla data di osservazione
Valore
Variazione assoluta
La variazione rispetto al valore precedente
1 gen 1961 anni
90.848
+90.848
0.0%
1 gen 1962 anni
88.874
-1.974
-2.17%
1 gen 1963 anni
89.591
+0.717
0.81%
1 gen 1964 anni
88.679
-0.912
-1.02%
1 gen 1965 anni
89.014
+0.335
0.38%
1 gen 1966 anni
87.054
-1.96
-2.2%
1 gen 1967 anni
84.944
-2.11
-2.42%
1 gen 1968 anni
83.232
-1.713
-2.02%
1 gen 1969 anni
83.963
+0.732
0.88%
1 gen 1970 anni
84.295
+0.332
0.4%
1 gen 1971 anni
78.677
-5.618
-6.67%
1 gen 1972 anni
77.153
-1.524
-1.94%
1 gen 1973 anni
78.056
+0.903
1.17%
1 gen 1974 anni
79.047
+0.99
1.27%
1 gen 1975 anni
79.608
+0.561
0.71%
1 gen 1976 anni
84.973
+5.366
6.74%
1 gen 1977 anni
88.082
+3.109
3.66%
1 gen 1978 anni
87.583
-0.499
-0.57%
1 gen 1979 anni
85.295
-2.288
-2.61%
1 gen 1980 anni
87.033
+1.737
2.04%
1 gen 1981 anni
89.56
+2.527
2.9%
1 gen 1982 anni
86.503
-3.057
-3.41%
1 gen 1983 anni
82.689
-3.814
-4.41%
1 gen 1984 anni
83.98
+1.291
1.56%
1 gen 1985 anni
81.122
-2.858
-3.4%
1 gen 1986 anni
84.464
+3.341
4.12%
1 gen 1987 anni
86.669
+2.205
2.61%
1 gen 1988 anni
84.39
-2.279
-2.63%
1 gen 1989 anni
83.254
-1.136
-1.35%
1 gen 1990 anni
81.957
-1.297
-1.56%
1 gen 1991 anni
78.467
-3.49
-4.26%
1 gen 1992 anni
76.355
-2.112
-2.69%
1 gen 1993 anni
74.421
-1.934
-2.53%
1 gen 1994 anni
77.938
+3.516
4.73%
1 gen 1995 anni
77.167
-0.77
-0.99%
1 gen 1996 anni
74.889
-2.279
-2.95%
1 gen 1997 anni
78.121
+3.232
4.32%
1 gen 1998 anni
80.83
+2.709
3.47%
1 gen 1999 anni
84.352
+3.523
4.36%
1 gen 2000 anni
79.022
-5.331
-6.32%
1 gen 2001 anni
79.86
+0.838
1.06%
1 gen 2002 anni
80.44
+0.58
0.73%
1 gen 2003 anni
80.339
-0.101
-0.13%
1 gen 2004 anni
76.788
-3.552
-4.42%
1 gen 2005 anni
76.02
-0.768
-1.0%
1 gen 2006 anni
70.779
-5.241
-6.89%
1 gen 2007 anni
67.384
-3.394
-4.8%
1 gen 2008 anni
66.956
-0.428
-0.64%
1 gen 2009 anni
65.45
-1.506
-2.25%
1 gen 2010 anni
62.376
-3.074
-4.7%
1 gen 2011 anni
60.825
-1.551
-2.49%
1 gen 2012 anni
49.303
-11.523
-18.94%
1 gen 2013 anni
53.036
+3.733
7.57%
1 gen 2014 anni
54.417
+1.381
2.6%
1 gen 2015 anni
50.495
-3.922
-7.21%
Classificazione dei paesi secondo i statistiche attuali per anni


Commenti: