29
/it/
it
AIzaSyAYiBZKx7MnpbEhh9jyipgxe19OcubqV5w
April 1, 2024
216722
Pakistan
PAK
true
2
1
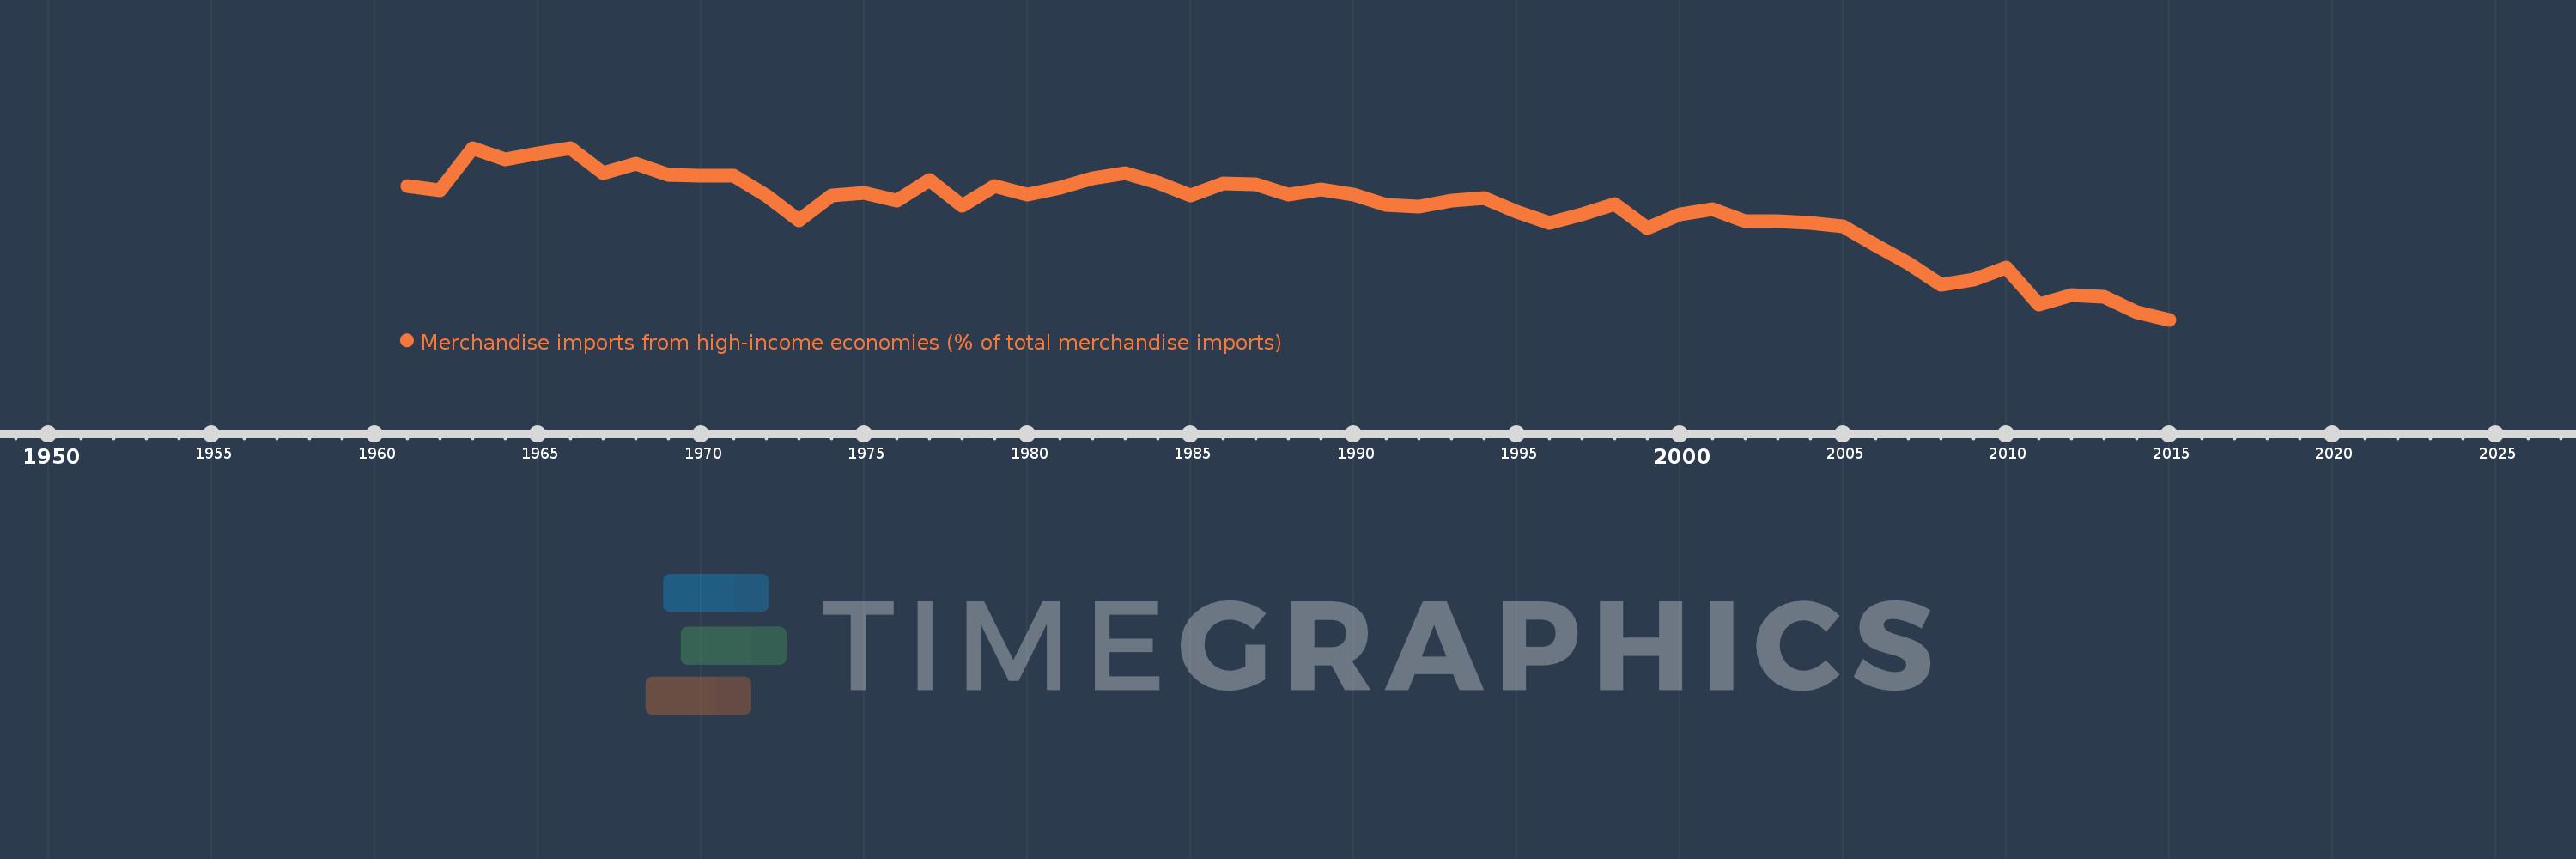
Merchandise imports from high-income economies (% of total merchandise imports)
2015,2014,2013,2012,2011,2010,2009,2008,2007,2006,2005,2004,2003,2002,2001,2000,1999,1998,1997,1996,1995,1994,1993,1992,1991,1990,1989,1988,1987,1986,1985,1984,1983,1982,1981,1980,1979,1978,1977,1976,1975,1974,1973,1972,1971,1970,1969,1968,1967,1966,1965,1964,1963,1962,1961
Queste statistiche in altri paesi:
AfghanistanAlbaniaAlgeriaAngolaAntigua and BarbudaArab WorldArgentinaArmeniaArubaAustraliaAustriaAzerbaijanBahamas, TheBahrainBangladeshBarbadosBelarusBelgiumBelizeBeninBermudaBoliviaBosnia and HerzegovinaBrazilBrunei DarussalamBulgariaBurkina FasoBurundiCabo VerdeCambodiaCameroonCanadaCaribbean small statesCentral African RepublicCentral Europe and the BalticsChadChileChinaColombiaComorosCongo, Dem. Rep.Congo, Rep.Costa RicaCote d'IvoireCroatiaCubaCyprusCzech RepublicDenmarkDjiboutiDominicaDominican RepublicEarly-demographic dividendEast Asia & PacificEast Asia & Pacific (excluding high income)East Asia & Pacific (IDA & IBRD countries)EcuadorEgypt, Arab Rep.El SalvadorEquatorial GuineaEstoniaEthiopiaEuro areaEurope & Central AsiaEurope & Central Asia (excluding high income)Europe & Central Asia (IDA & IBRD countries)European UnionFaroe IslandsFijiFinlandFragile and conflict affected situationsFranceFrench PolynesiaGabonGambia, TheGeorgiaGermanyGhanaGibraltarGreeceGreenlandGrenadaGuamGuatemalaGuineaGuinea-BissauGuyanaHaitiHeavily indebted poor countries (HIPC)High incomeHondurasHong Kong SAR, ChinaHungaryIBRD onlyIcelandIDA & IBRD totalIDA blendIDA onlyIDA totalIndiaIndonesiaIran, Islamic Rep.IraqIrelandIsraelItalyJamaicaJapanJordanKazakhstanKenyaKiribatiKorea, Dem. People’s Rep.Korea, Rep.KosovoKuwaitKyrgyz RepublicLao PDRLate-demographic dividendLatin America & Caribbean Latin America & Caribbean (excluding high income)Latin America & the Caribbean (IDA & IBRD countries)LatviaLeast developed countries: UN classificationLebanonLiberiaLibyaLithuaniaLow & middle incomeLow incomeLower middle incomeLuxembourgMacao SAR, ChinaMacedonia, FYRMadagascarMalawiMalaysiaMaldivesMaliMaltaMauritaniaMauritiusMexicoMiddle East & North AfricaMiddle East & North Africa (excluding high income)Middle East & North Africa (IDA & IBRD countries)Middle incomeMoldovaMongoliaMontenegroMoroccoMozambiqueMyanmarNauruNepalNetherlandsNew CaledoniaNew ZealandNicaraguaNigerNigeriaNorth AmericaNorwayOECD membersOmanOther small statesPacific island small statesPakistanPanamaPapua New GuineaParaguayPeruPhilippinesPolandPortugalPost-demographic dividendPre-demographic dividendQatarRomaniaRussian FederationRwandaSamoaSao Tome and PrincipeSaudi ArabiaSenegalSerbiaSeychellesSierra LeoneSingaporeSlovak RepublicSloveniaSmall statesSolomon IslandsSomaliaSouth AfricaSouth AsiaSouth Asia (IDA & IBRD)SpainSri LankaSt. Kitts and NevisSt. LuciaSt. Vincent and the GrenadinesSub-Saharan Africa Sub-Saharan Africa (excluding high income)Sub-Saharan Africa (IDA & IBRD countries)SudanSurinameSwedenSwitzerlandSyrian Arab RepublicTajikistanTanzaniaThailandTogoTongaTrinidad and TobagoTunisiaTurkeyTurkmenistanTuvaluUgandaUkraineUnited Arab EmiratesUnited KingdomUnited StatesUpper middle incomeUruguayUzbekistanVanuatuVenezuela, RBVietnamWorldYemen, Rep.ZambiaZimbabwe Linea del tempo:
Questa scala temporale mostra un grafico dal 1961 anno al 2015 anno. Pakistan. I dati fino ad 1960 anno non disponibili. Il numero di osservazioni attuali secondo i date: 55.
La fonte (nome):
Indicatori dello sviluppo mondiale
La fonte (organizzazione):
World Bank staff estimates based data from International Monetary Fund's Direction of Trade database.
Categorie:
Private Sector, Trade
sono stati aggiornati
23 apr 2017 anni
Indicatori delle variazioni dei valori per anni
Minima:
54.305
1 gen 2015 anni
Massimo:
88.077
1 gen 1966 anni
Alla data di osservazione
Valore
Variazione assoluta
La variazione rispetto al valore precedente
1 gen 1961 anni
80.612
+80.612
0.0%
1 gen 1962 anni
79.82
-0.792
-0.98%
1 gen 1963 anni
88.037
+8.217
10.29%
1 gen 1964 anni
85.893
-2.145
-2.44%
1 gen 1965 anni
86.969
+1.076
1.25%
1 gen 1966 anni
88.077
+1.108
1.27%
1 gen 1967 anni
83.152
-4.926
-5.59%
1 gen 1968 anni
84.991
+1.839
2.21%
1 gen 1969 anni
82.842
-2.149
-2.53%
1 gen 1970 anni
82.565
-0.277
-0.33%
1 gen 1971 anni
82.634
+0.07
0.08%
1 gen 1972 anni
78.813
-3.821
-4.62%
1 gen 1973 anni
73.829
-4.984
-6.32%
1 gen 1974 anni
78.731
+4.901
6.64%
1 gen 1975 anni
79.239
+0.508
0.65%
1 gen 1976 anni
77.732
-1.507
-1.9%
1 gen 1977 anni
81.73
+3.998
5.14%
1 gen 1978 anni
76.78
-4.95
-6.06%
1 gen 1979 anni
80.564
+3.784
4.93%
1 gen 1980 anni
78.862
-1.701
-2.11%
1 gen 1981 anni
80.323
+1.461
1.85%
1 gen 1982 anni
82.195
+1.872
2.33%
1 gen 1983 anni
83.077
+0.881
1.07%
1 gen 1984 anni
81.331
-1.746
-2.1%
1 gen 1985 anni
78.73
-2.601
-3.2%
1 gen 1986 anni
81.127
+2.397
3.04%
1 gen 1987 anni
80.948
-0.179
-0.22%
1 gen 1988 anni
78.845
-2.104
-2.6%
1 gen 1989 anni
79.969
+1.124
1.43%
1 gen 1990 anni
78.876
-1.092
-1.37%
1 gen 1991 anni
76.892
-1.984
-2.52%
1 gen 1992 anni
76.471
-0.421
-0.55%
1 gen 1993 anni
77.701
+1.23
1.61%
1 gen 1994 anni
78.188
+0.487
0.63%
1 gen 1995 anni
75.468
-2.72
-3.48%
1 gen 1996 anni
73.326
-2.142
-2.84%
1 gen 1997 anni
74.993
+1.667
2.27%
1 gen 1998 anni
77.054
+2.061
2.75%
1 gen 1999 anni
72.392
-4.662
-6.05%
1 gen 2000 anni
74.996
+2.604
3.6%
1 gen 2001 anni
76.093
+1.097
1.46%
1 gen 2002 anni
73.723
-2.37
-3.11%
1 gen 2003 anni
73.646
-0.076
-0.1%
1 gen 2004 anni
73.281
-0.365
-0.5%
1 gen 2005 anni
72.589
-0.692
-0.94%
1 gen 2006 anni
68.981
-3.608
-4.97%
1 gen 2007 anni
65.335
-3.646
-5.29%
1 gen 2008 anni
61.187
-4.148
-6.35%
1 gen 2009 anni
62.214
+1.027
1.68%
1 gen 2010 anni
64.489
+2.275
3.66%
1 gen 2011 anni
57.211
-7.278
-11.29%
1 gen 2012 anni
59.15
+1.939
3.39%
1 gen 2013 anni
58.845
-0.304
-0.51%
1 gen 2014 anni
55.832
-3.013
-5.12%
1 gen 2015 anni
54.305
-1.527
-2.74%
Classificazione dei paesi secondo i statistiche attuali per anni


Commenti: