29
/it/
it
AIzaSyAYiBZKx7MnpbEhh9jyipgxe19OcubqV5w
April 1, 2024
151808
Hong Kong SAR, China
HKG
true
2
1
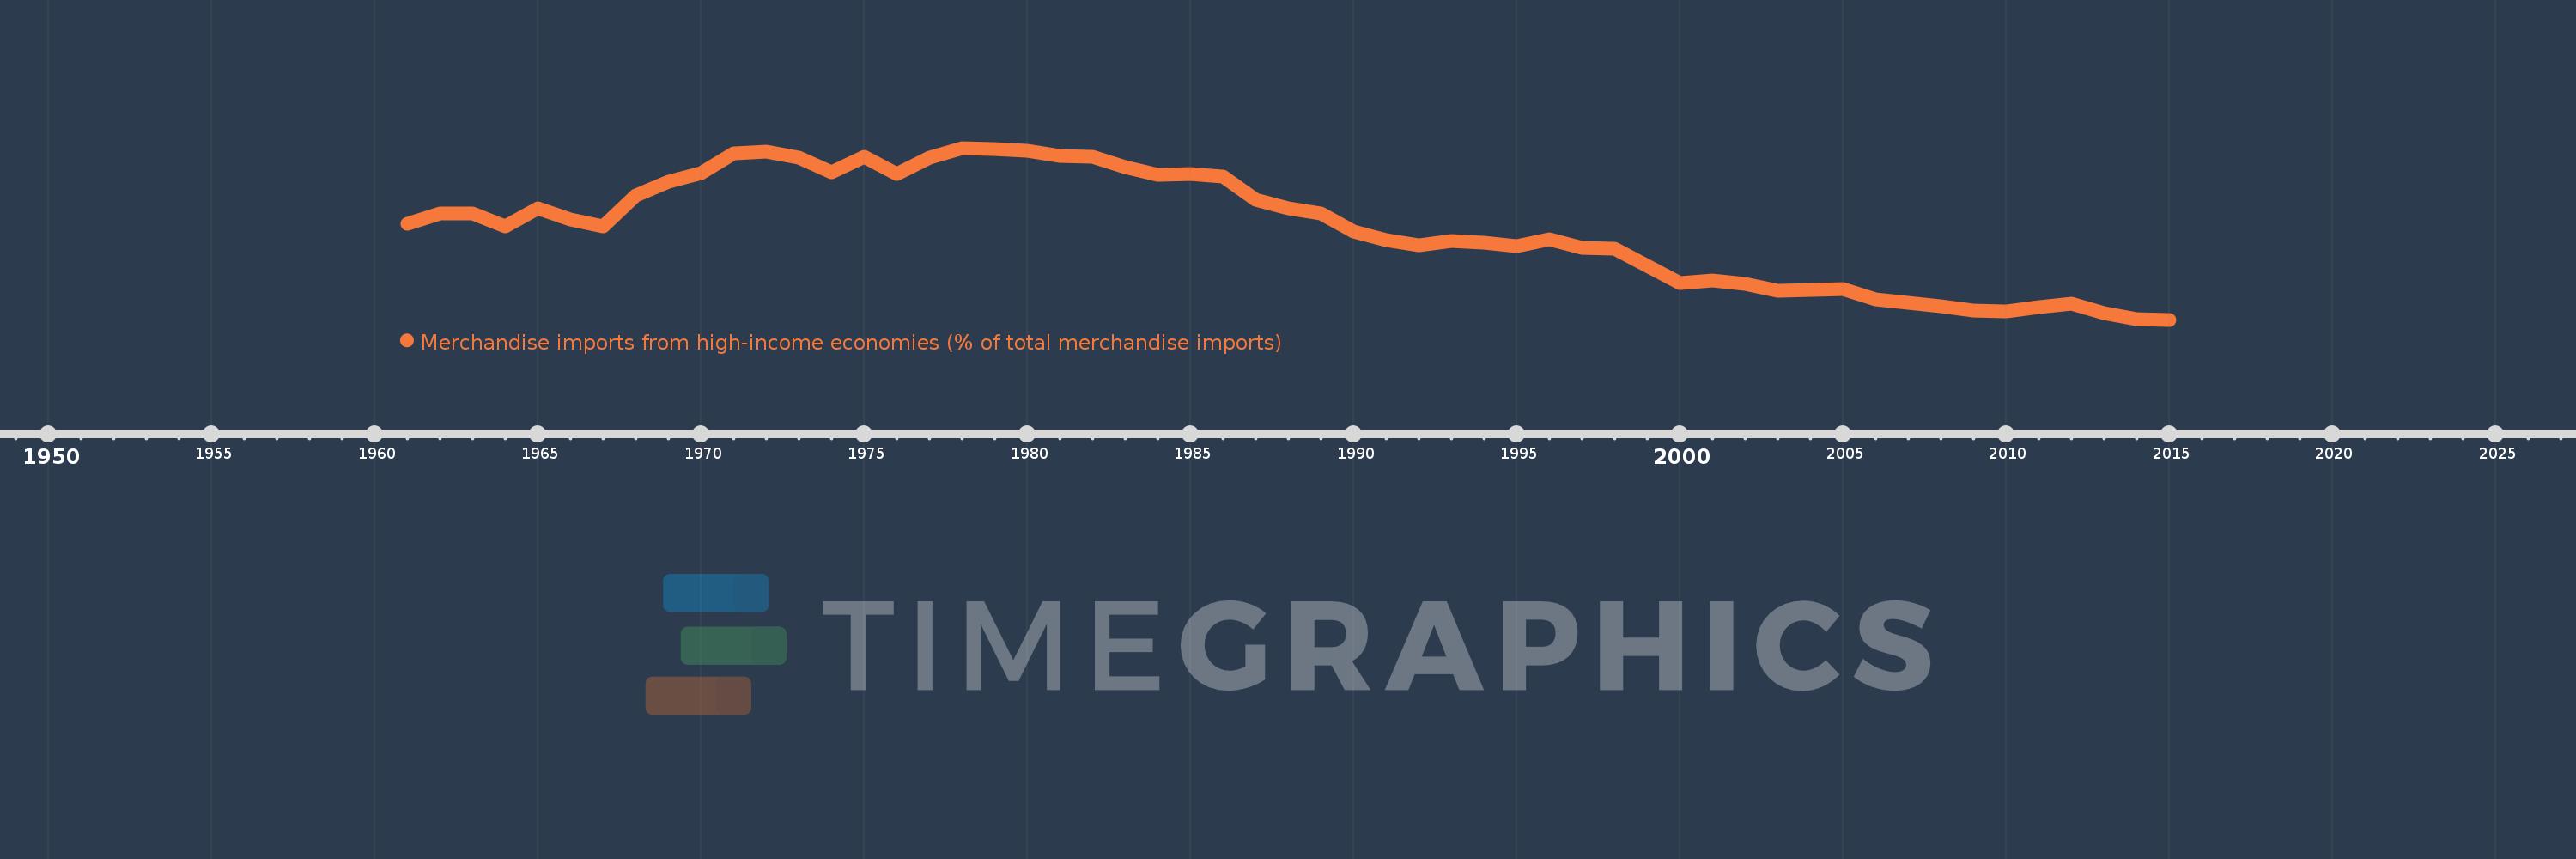
Merchandise imports from high-income economies (% of total merchandise imports)
2015,2014,2013,2012,2011,2010,2009,2008,2007,2006,2005,2004,2003,2002,2001,2000,1999,1998,1997,1996,1995,1994,1993,1992,1991,1990,1989,1988,1987,1986,1985,1984,1983,1982,1981,1980,1979,1978,1977,1976,1975,1974,1973,1972,1971,1970,1969,1968,1967,1966,1965,1964,1963,1962,1961
Queste statistiche in altri paesi:
AfghanistanAlbaniaAlgeriaAngolaAntigua and BarbudaArab WorldArgentinaArmeniaArubaAustraliaAustriaAzerbaijanBahamas, TheBahrainBangladeshBarbadosBelarusBelgiumBelizeBeninBermudaBoliviaBosnia and HerzegovinaBrazilBrunei DarussalamBulgariaBurkina FasoBurundiCabo VerdeCambodiaCameroonCanadaCaribbean small statesCentral African RepublicCentral Europe and the BalticsChadChileChinaColombiaComorosCongo, Dem. Rep.Congo, Rep.Costa RicaCote d'IvoireCroatiaCubaCyprusCzech RepublicDenmarkDjiboutiDominicaDominican RepublicEarly-demographic dividendEast Asia & PacificEast Asia & Pacific (excluding high income)East Asia & Pacific (IDA & IBRD countries)EcuadorEgypt, Arab Rep.El SalvadorEquatorial GuineaEstoniaEthiopiaEuro areaEurope & Central AsiaEurope & Central Asia (excluding high income)Europe & Central Asia (IDA & IBRD countries)European UnionFaroe IslandsFijiFinlandFragile and conflict affected situationsFranceFrench PolynesiaGabonGambia, TheGeorgiaGermanyGhanaGibraltarGreeceGreenlandGrenadaGuamGuatemalaGuineaGuinea-BissauGuyanaHaitiHeavily indebted poor countries (HIPC)High incomeHondurasHong Kong SAR, ChinaHungaryIBRD onlyIcelandIDA & IBRD totalIDA blendIDA onlyIDA totalIndiaIndonesiaIran, Islamic Rep.IraqIrelandIsraelItalyJamaicaJapanJordanKazakhstanKenyaKiribatiKorea, Dem. People’s Rep.Korea, Rep.KosovoKuwaitKyrgyz RepublicLao PDRLate-demographic dividendLatin America & Caribbean Latin America & Caribbean (excluding high income)Latin America & the Caribbean (IDA & IBRD countries)LatviaLeast developed countries: UN classificationLebanonLiberiaLibyaLithuaniaLow & middle incomeLow incomeLower middle incomeLuxembourgMacao SAR, ChinaMacedonia, FYRMadagascarMalawiMalaysiaMaldivesMaliMaltaMauritaniaMauritiusMexicoMiddle East & North AfricaMiddle East & North Africa (excluding high income)Middle East & North Africa (IDA & IBRD countries)Middle incomeMoldovaMongoliaMontenegroMoroccoMozambiqueMyanmarNauruNepalNetherlandsNew CaledoniaNew ZealandNicaraguaNigerNigeriaNorth AmericaNorwayOECD membersOmanOther small statesPacific island small statesPakistanPanamaPapua New GuineaParaguayPeruPhilippinesPolandPortugalPost-demographic dividendPre-demographic dividendQatarRomaniaRussian FederationRwandaSamoaSao Tome and PrincipeSaudi ArabiaSenegalSerbiaSeychellesSierra LeoneSingaporeSlovak RepublicSloveniaSmall statesSolomon IslandsSomaliaSouth AfricaSouth AsiaSouth Asia (IDA & IBRD)SpainSri LankaSt. Kitts and NevisSt. LuciaSt. Vincent and the GrenadinesSub-Saharan Africa Sub-Saharan Africa (excluding high income)Sub-Saharan Africa (IDA & IBRD countries)SudanSurinameSwedenSwitzerlandSyrian Arab RepublicTajikistanTanzaniaThailandTogoTongaTrinidad and TobagoTunisiaTurkeyTurkmenistanTuvaluUgandaUkraineUnited Arab EmiratesUnited KingdomUnited StatesUpper middle incomeUruguayUzbekistanVanuatuVenezuela, RBVietnamWorldYemen, Rep.ZambiaZimbabwe Linea del tempo:
Questa scala temporale mostra un grafico dal 1961 anno al 2015 anno. Hong Kong SAR, China. I dati fino ad 1960 anno non disponibili. Il numero di osservazioni attuali secondo i date: 55.
La fonte (nome):
Indicatori dello sviluppo mondiale
La fonte (organizzazione):
World Bank staff estimates based data from International Monetary Fund's Direction of Trade database.
Categorie:
Private Sector, Trade
sono stati aggiornati
23 apr 2017 anni
Indicatori delle variazioni dei valori per anni
Minima:
41.573
1 gen 2015 anni
Massimo:
72.354
1 gen 1978 anni
Alla data di osservazione
Valore
Variazione assoluta
La variazione rispetto al valore precedente
1 gen 1961 anni
58.812
+58.812
0.0%
1 gen 1962 anni
60.673
+1.861
3.16%
1 gen 1963 anni
60.683
+0.009
0.02%
1 gen 1964 anni
58.258
-2.425
-4.0%
1 gen 1965 anni
61.571
+3.314
5.69%
1 gen 1966 anni
59.458
-2.113
-3.43%
1 gen 1967 anni
58.267
-1.191
-2.0%
1 gen 1968 anni
63.89
+5.622
9.65%
1 gen 1969 anni
66.231
+2.341
3.66%
1 gen 1970 anni
67.772
+1.541
2.33%
1 gen 1971 anni
71.345
+3.573
5.27%
1 gen 1972 anni
71.704
+0.359
0.5%
1 gen 1973 anni
70.55
-1.154
-1.61%
1 gen 1974 anni
68.067
-2.483
-3.52%
1 gen 1975 anni
70.821
+2.754
4.05%
1 gen 1976 anni
67.681
-3.14
-4.43%
1 gen 1977 anni
70.54
+2.859
4.22%
1 gen 1978 anni
72.354
+1.814
2.57%
1 gen 1979 anni
72.221
-0.133
-0.18%
1 gen 1980 anni
71.91
-0.311
-0.43%
1 gen 1981 anni
70.889
-1.021
-1.42%
1 gen 1982 anni
70.782
-0.107
-0.15%
1 gen 1983 anni
68.95
-1.833
-2.59%
1 gen 1984 anni
67.463
-1.486
-2.16%
1 gen 1985 anni
67.687
+0.223
0.33%
1 gen 1986 anni
67.234
-0.452
-0.67%
1 gen 1987 anni
63.041
-4.193
-6.24%
1 gen 1988 anni
61.583
-1.458
-2.31%
1 gen 1989 anni
60.589
-0.994
-1.61%
1 gen 1990 anni
57.395
-3.194
-5.27%
1 gen 1991 anni
55.843
-1.551
-2.7%
1 gen 1992 anni
54.897
-0.947
-1.7%
1 gen 1993 anni
55.752
+0.856
1.56%
1 gen 1994 anni
55.322
-0.43
-0.77%
1 gen 1995 anni
54.833
-0.489
-0.88%
1 gen 1996 anni
55.97
+1.136
2.07%
1 gen 1997 anni
54.518
-1.452
-2.59%
1 gen 1998 anni
54.303
-0.216
-0.4%
1 gen 1999 anni
51.227
-3.075
-5.66%
1 gen 2000 anni
48.121
-3.106
-6.06%
1 gen 2001 anni
48.556
+0.435
0.9%
1 gen 2002 anni
47.951
-0.606
-1.25%
1 gen 2003 anni
46.749
-1.202
-2.51%
1 gen 2004 anni
46.872
+0.123
0.26%
1 gen 2005 anni
47.059
+0.187
0.4%
1 gen 2006 anni
45.197
-1.862
-3.96%
1 gen 2007 anni
44.674
-0.522
-1.16%
1 gen 2008 anni
43.965
-0.709
-1.59%
1 gen 2009 anni
43.293
-0.672
-1.53%
1 gen 2010 anni
43.106
-0.187
-0.43%
1 gen 2011 anni
43.864
+0.757
1.76%
1 gen 2012 anni
44.469
+0.605
1.38%
1 gen 2013 anni
42.685
-1.783
-4.01%
1 gen 2014 anni
41.684
-1.002
-2.35%
1 gen 2015 anni
41.573
-0.111
-0.27%
Classificazione dei paesi secondo i statistiche attuali per anni


Commenti: