29
/it/
it
AIzaSyAYiBZKx7MnpbEhh9jyipgxe19OcubqV5w
April 1, 2024
223864
Philippines
PHL
true
2
1
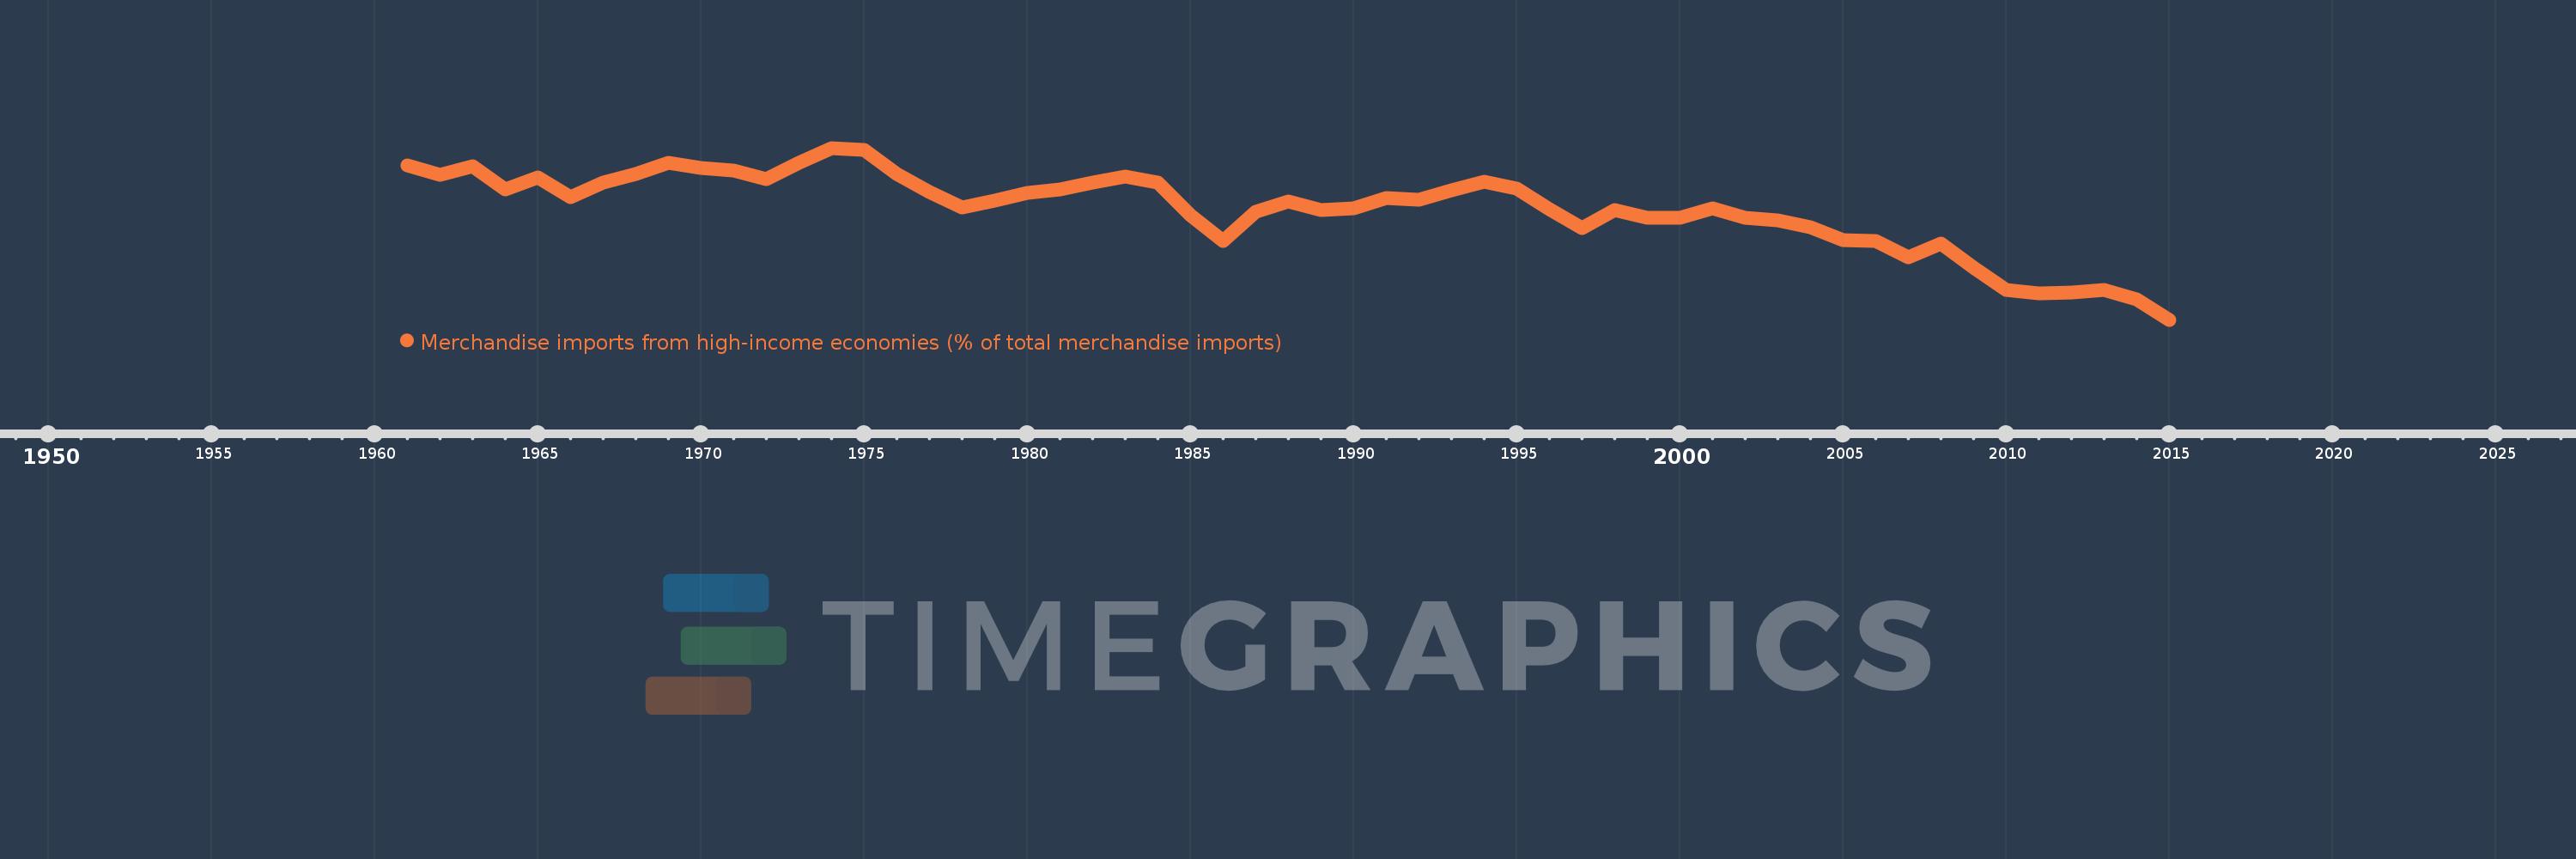
Merchandise imports from high-income economies (% of total merchandise imports)
2015,2014,2013,2012,2011,2010,2009,2008,2007,2006,2005,2004,2003,2002,2001,2000,1999,1998,1997,1996,1995,1994,1993,1992,1991,1990,1989,1988,1987,1986,1985,1984,1983,1982,1981,1980,1979,1978,1977,1976,1975,1974,1973,1972,1971,1970,1969,1968,1967,1966,1965,1964,1963,1962,1961
Queste statistiche in altri paesi:
AfghanistanAlbaniaAlgeriaAngolaAntigua and BarbudaArab WorldArgentinaArmeniaArubaAustraliaAustriaAzerbaijanBahamas, TheBahrainBangladeshBarbadosBelarusBelgiumBelizeBeninBermudaBoliviaBosnia and HerzegovinaBrazilBrunei DarussalamBulgariaBurkina FasoBurundiCabo VerdeCambodiaCameroonCanadaCaribbean small statesCentral African RepublicCentral Europe and the BalticsChadChileChinaColombiaComorosCongo, Dem. Rep.Congo, Rep.Costa RicaCote d'IvoireCroatiaCubaCyprusCzech RepublicDenmarkDjiboutiDominicaDominican RepublicEarly-demographic dividendEast Asia & PacificEast Asia & Pacific (excluding high income)East Asia & Pacific (IDA & IBRD countries)EcuadorEgypt, Arab Rep.El SalvadorEquatorial GuineaEstoniaEthiopiaEuro areaEurope & Central AsiaEurope & Central Asia (excluding high income)Europe & Central Asia (IDA & IBRD countries)European UnionFaroe IslandsFijiFinlandFragile and conflict affected situationsFranceFrench PolynesiaGabonGambia, TheGeorgiaGermanyGhanaGibraltarGreeceGreenlandGrenadaGuamGuatemalaGuineaGuinea-BissauGuyanaHaitiHeavily indebted poor countries (HIPC)High incomeHondurasHong Kong SAR, ChinaHungaryIBRD onlyIcelandIDA & IBRD totalIDA blendIDA onlyIDA totalIndiaIndonesiaIran, Islamic Rep.IraqIrelandIsraelItalyJamaicaJapanJordanKazakhstanKenyaKiribatiKorea, Dem. People’s Rep.Korea, Rep.KosovoKuwaitKyrgyz RepublicLao PDRLate-demographic dividendLatin America & Caribbean Latin America & Caribbean (excluding high income)Latin America & the Caribbean (IDA & IBRD countries)LatviaLeast developed countries: UN classificationLebanonLiberiaLibyaLithuaniaLow & middle incomeLow incomeLower middle incomeLuxembourgMacao SAR, ChinaMacedonia, FYRMadagascarMalawiMalaysiaMaldivesMaliMaltaMauritaniaMauritiusMexicoMiddle East & North AfricaMiddle East & North Africa (excluding high income)Middle East & North Africa (IDA & IBRD countries)Middle incomeMoldovaMongoliaMontenegroMoroccoMozambiqueMyanmarNauruNepalNetherlandsNew CaledoniaNew ZealandNicaraguaNigerNigeriaNorth AmericaNorwayOECD membersOmanOther small statesPacific island small statesPakistanPanamaPapua New GuineaParaguayPeruPhilippinesPolandPortugalPost-demographic dividendPre-demographic dividendQatarRomaniaRussian FederationRwandaSamoaSao Tome and PrincipeSaudi ArabiaSenegalSerbiaSeychellesSierra LeoneSingaporeSlovak RepublicSloveniaSmall statesSolomon IslandsSomaliaSouth AfricaSouth AsiaSouth Asia (IDA & IBRD)SpainSri LankaSt. Kitts and NevisSt. LuciaSt. Vincent and the GrenadinesSub-Saharan Africa Sub-Saharan Africa (excluding high income)Sub-Saharan Africa (IDA & IBRD countries)SudanSurinameSwedenSwitzerlandSyrian Arab RepublicTajikistanTanzaniaThailandTogoTongaTrinidad and TobagoTunisiaTurkeyTurkmenistanTuvaluUgandaUkraineUnited Arab EmiratesUnited KingdomUnited StatesUpper middle incomeUruguayUzbekistanVanuatuVenezuela, RBVietnamWorldYemen, Rep.ZambiaZimbabwe Linea del tempo:
Questa scala temporale mostra un grafico dal 1961 anno al 2015 anno. Philippines. I dati fino ad 1960 anno non disponibili. Il numero di osservazioni attuali secondo i date: 55.
La fonte (nome):
Indicatori dello sviluppo mondiale
La fonte (organizzazione):
World Bank staff estimates based data from International Monetary Fund's Direction of Trade database.
Categorie:
Private Sector, Trade
sono stati aggiornati
23 apr 2017 anni
Indicatori delle variazioni dei valori per anni
Minima:
65.427
1 gen 2015 anni
Massimo:
94.2
1 gen 1974 anni
Alla data di osservazione
Valore
Variazione assoluta
La variazione rispetto al valore precedente
1 gen 1961 anni
91.29
+91.29
0.0%
1 gen 1962 anni
89.717
-1.572
-1.72%
1 gen 1963 anni
91.201
+1.484
1.65%
1 gen 1964 anni
87.256
-3.945
-4.33%
1 gen 1965 anni
89.306
+2.05
2.35%
1 gen 1966 anni
86.008
-3.298
-3.69%
1 gen 1967 anni
88.334
+2.325
2.7%
1 gen 1968 anni
89.843
+1.509
1.71%
1 gen 1969 anni
91.751
+1.909
2.12%
1 gen 1970 anni
90.915
-0.837
-0.91%
1 gen 1971 anni
90.412
-0.503
-0.55%
1 gen 1972 anni
89.028
-1.384
-1.53%
1 gen 1973 anni
91.772
+2.745
3.08%
1 gen 1974 anni
94.2
+2.428
2.65%
1 gen 1975 anni
93.893
-0.307
-0.33%
1 gen 1976 anni
89.81
-4.082
-4.35%
1 gen 1977 anni
86.779
-3.032
-3.38%
1 gen 1978 anni
84.293
-2.486
-2.86%
1 gen 1979 anni
85.362
+1.069
1.27%
1 gen 1980 anni
86.699
+1.337
1.57%
1 gen 1981 anni
87.205
+0.506
0.58%
1 gen 1982 anni
88.346
+1.141
1.31%
1 gen 1983 anni
89.381
+1.035
1.17%
1 gen 1984 anni
88.407
-0.974
-1.09%
1 gen 1985 anni
83.006
-5.401
-6.11%
1 gen 1986 anni
78.609
-4.397
-5.3%
1 gen 1987 anni
83.563
+4.954
6.3%
1 gen 1988 anni
85.212
+1.649
1.97%
1 gen 1989 anni
83.776
-1.437
-1.69%
1 gen 1990 anni
84.108
+0.333
0.4%
1 gen 1991 anni
85.858
+1.75
2.08%
1 gen 1992 anni
85.594
-0.264
-0.31%
1 gen 1993 anni
87.145
+1.552
1.81%
1 gen 1994 anni
88.554
+1.409
1.62%
1 gen 1995 anni
87.461
-1.092
-1.23%
1 gen 1996 anni
83.943
-3.518
-4.02%
1 gen 1997 anni
80.783
-3.161
-3.77%
1 gen 1998 anni
83.815
+3.032
3.75%
1 gen 1999 anni
82.556
-1.259
-1.5%
1 gen 2000 anni
82.535
-0.021
-0.03%
1 gen 2001 anni
84.136
+1.6
1.94%
1 gen 2002 anni
82.498
-1.638
-1.95%
1 gen 2003 anni
82.083
-0.415
-0.5%
1 gen 2004 anni
80.903
-1.181
-1.44%
1 gen 2005 anni
78.808
-2.094
-2.59%
1 gen 2006 anni
78.579
-0.23
-0.29%
1 gen 2007 anni
75.953
-2.626
-3.34%
1 gen 2008 anni
78.153
+2.201
2.9%
1 gen 2009 anni
74.163
-3.99
-5.11%
1 gen 2010 anni
70.375
-3.788
-5.11%
1 gen 2011 anni
69.773
-0.602
-0.86%
1 gen 2012 anni
70.036
+0.262
0.38%
1 gen 2013 anni
70.373
+0.338
0.48%
1 gen 2014 anni
68.786
-1.587
-2.26%
1 gen 2015 anni
65.427
-3.359
-4.88%
Classificazione dei paesi secondo i statistiche attuali per anni


Commenti: