29
/it/
it
AIzaSyAYiBZKx7MnpbEhh9jyipgxe19OcubqV5w
April 1, 2024
35947
High income
HIC
false
2
1
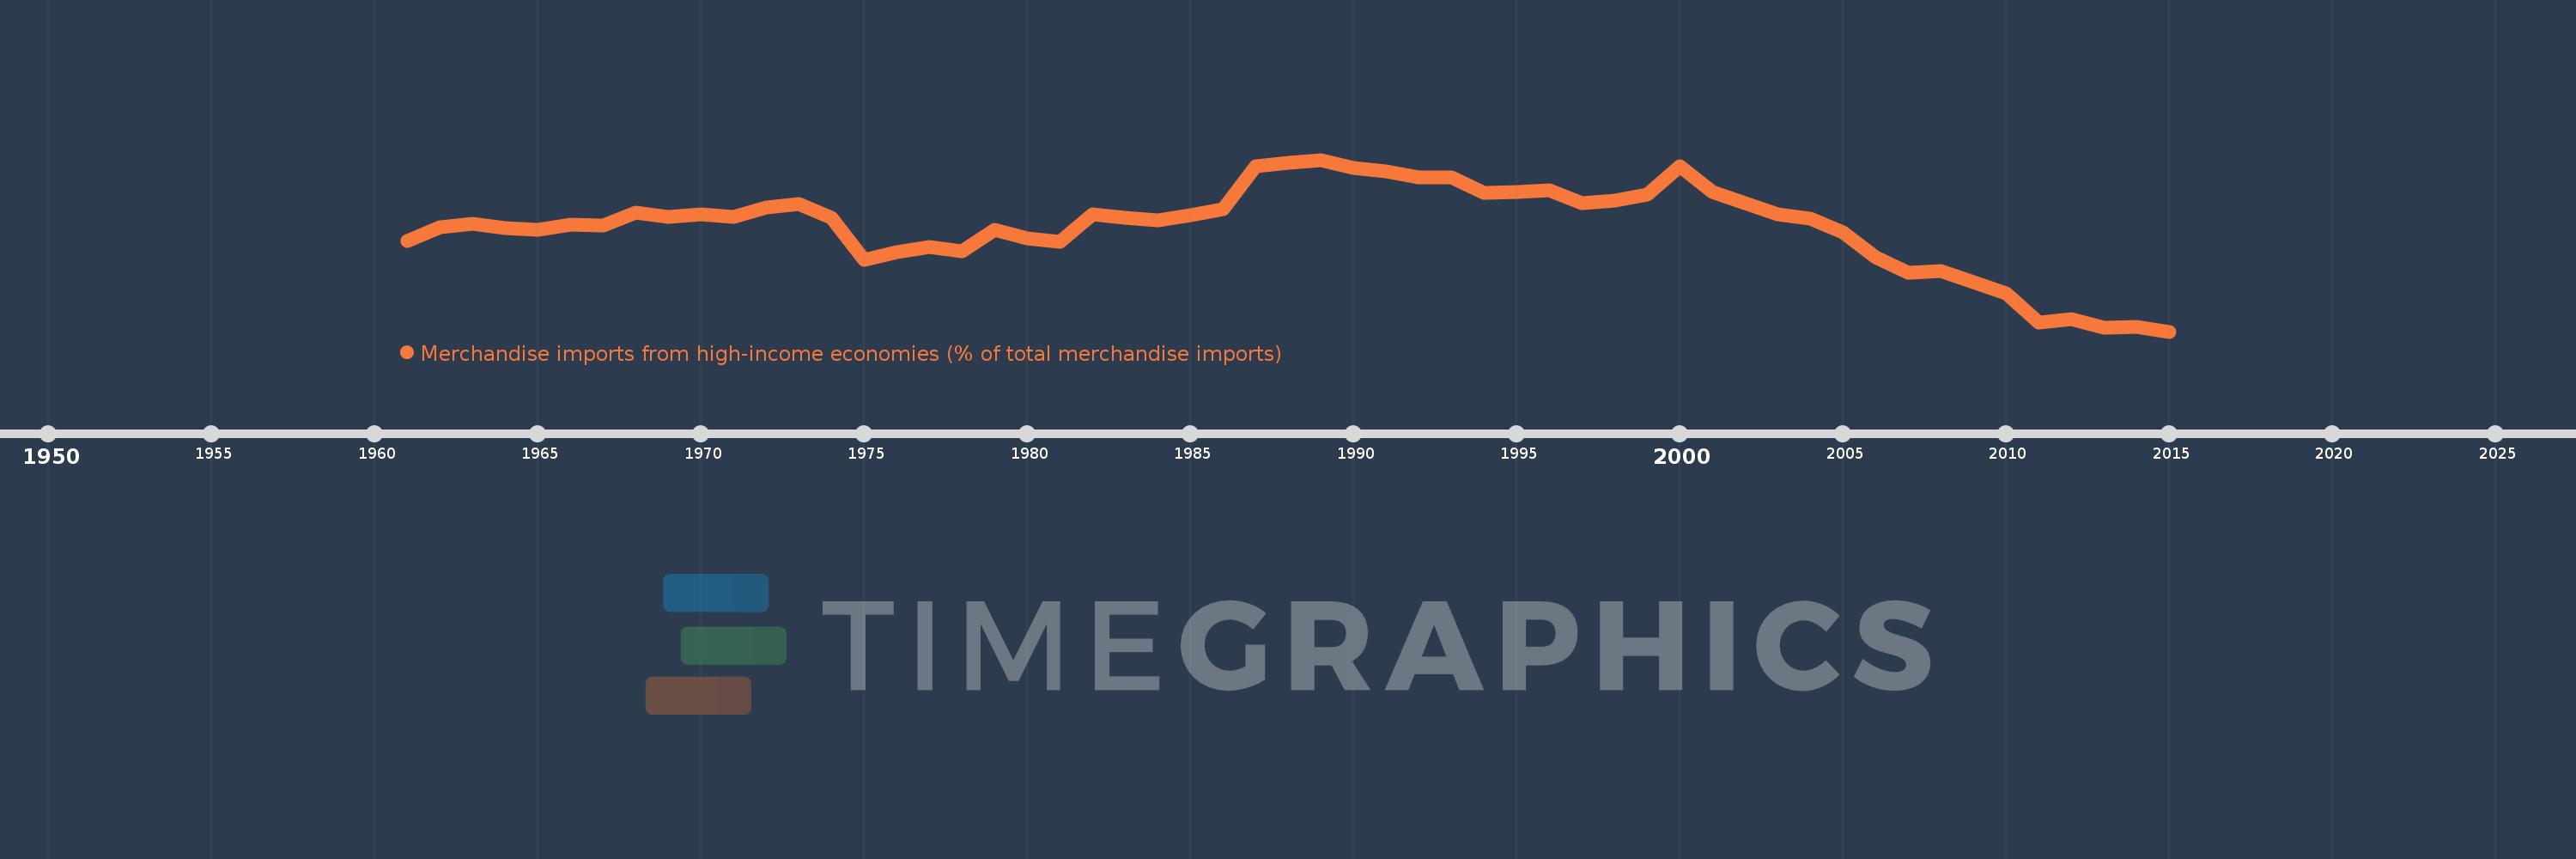
Merchandise imports from high-income economies (% of total merchandise imports)
2015,2014,2013,2012,2011,2010,2009,2008,2007,2006,2005,2004,2003,2002,2001,2000,1999,1998,1997,1996,1995,1994,1993,1992,1991,1990,1989,1988,1987,1986,1985,1984,1983,1982,1981,1980,1979,1978,1977,1976,1975,1974,1973,1972,1971,1970,1969,1968,1967,1966,1965,1964,1963,1962,1961
Queste statistiche in altri paesi:
AfghanistanAlbaniaAlgeriaAngolaAntigua and BarbudaArab WorldArgentinaArmeniaArubaAustraliaAustriaAzerbaijanBahamas, TheBahrainBangladeshBarbadosBelarusBelgiumBelizeBeninBermudaBoliviaBosnia and HerzegovinaBrazilBrunei DarussalamBulgariaBurkina FasoBurundiCabo VerdeCambodiaCameroonCanadaCaribbean small statesCentral African RepublicCentral Europe and the BalticsChadChileChinaColombiaComorosCongo, Dem. Rep.Congo, Rep.Costa RicaCote d'IvoireCroatiaCubaCyprusCzech RepublicDenmarkDjiboutiDominicaDominican RepublicEarly-demographic dividendEast Asia & PacificEast Asia & Pacific (excluding high income)East Asia & Pacific (IDA & IBRD countries)EcuadorEgypt, Arab Rep.El SalvadorEquatorial GuineaEstoniaEthiopiaEuro areaEurope & Central AsiaEurope & Central Asia (excluding high income)Europe & Central Asia (IDA & IBRD countries)European UnionFaroe IslandsFijiFinlandFragile and conflict affected situationsFranceFrench PolynesiaGabonGambia, TheGeorgiaGermanyGhanaGibraltarGreeceGreenlandGrenadaGuamGuatemalaGuineaGuinea-BissauGuyanaHaitiHeavily indebted poor countries (HIPC)High incomeHondurasHong Kong SAR, ChinaHungaryIBRD onlyIcelandIDA & IBRD totalIDA blendIDA onlyIDA totalIndiaIndonesiaIran, Islamic Rep.IraqIrelandIsraelItalyJamaicaJapanJordanKazakhstanKenyaKiribatiKorea, Dem. People’s Rep.Korea, Rep.KosovoKuwaitKyrgyz RepublicLao PDRLate-demographic dividendLatin America & Caribbean Latin America & Caribbean (excluding high income)Latin America & the Caribbean (IDA & IBRD countries)LatviaLeast developed countries: UN classificationLebanonLiberiaLibyaLithuaniaLow & middle incomeLow incomeLower middle incomeLuxembourgMacao SAR, ChinaMacedonia, FYRMadagascarMalawiMalaysiaMaldivesMaliMaltaMauritaniaMauritiusMexicoMiddle East & North AfricaMiddle East & North Africa (excluding high income)Middle East & North Africa (IDA & IBRD countries)Middle incomeMoldovaMongoliaMontenegroMoroccoMozambiqueMyanmarNauruNepalNetherlandsNew CaledoniaNew ZealandNicaraguaNigerNigeriaNorth AmericaNorwayOECD membersOmanOther small statesPacific island small statesPakistanPanamaPapua New GuineaParaguayPeruPhilippinesPolandPortugalPost-demographic dividendPre-demographic dividendQatarRomaniaRussian FederationRwandaSamoaSao Tome and PrincipeSaudi ArabiaSenegalSerbiaSeychellesSierra LeoneSingaporeSlovak RepublicSloveniaSmall statesSolomon IslandsSomaliaSouth AfricaSouth AsiaSouth Asia (IDA & IBRD)SpainSri LankaSt. Kitts and NevisSt. LuciaSt. Vincent and the GrenadinesSub-Saharan Africa Sub-Saharan Africa (excluding high income)Sub-Saharan Africa (IDA & IBRD countries)SudanSurinameSwedenSwitzerlandSyrian Arab RepublicTajikistanTanzaniaThailandTogoTongaTrinidad and TobagoTunisiaTurkeyTurkmenistanTuvaluUgandaUkraineUnited Arab EmiratesUnited KingdomUnited StatesUpper middle incomeUruguayUzbekistanVanuatuVenezuela, RBVietnamWorldYemen, Rep.ZambiaZimbabwe Linea del tempo:
Questa scala temporale mostra un grafico dal 1961 anno al 2015 anno. High income. I dati fino ad 1960 anno non disponibili. Il numero di osservazioni attuali secondo i date: 55.
La fonte (nome):
Indicatori dello sviluppo mondiale
La fonte (organizzazione):
World Bank staff estimates based data from International Monetary Fund's Direction of Trade database.
Categorie:
Private Sector, Trade
sono stati aggiornati
23 apr 2017 anni
Indicatori delle variazioni dei valori per anni
Minima:
68.753
1 gen 2015 anni
Massimo:
79.8
1 gen 1989 anni
Alla data di osservazione
Valore
Variazione assoluta
La variazione rispetto al valore precedente
1 gen 1961 anni
74.568
+74.568
0.0%
1 gen 1962 anni
75.449
+0.881
1.18%
1 gen 1963 anni
75.694
+0.245
0.32%
1 gen 1964 anni
75.406
-0.288
-0.38%
1 gen 1965 anni
75.291
-0.115
-0.15%
1 gen 1966 anni
75.615
+0.324
0.43%
1 gen 1967 anni
75.599
-0.015
-0.02%
1 gen 1968 anni
76.393
+0.794
1.05%
1 gen 1969 anni
76.134
-0.259
-0.34%
1 gen 1970 anni
76.313
+0.179
0.24%
1 gen 1971 anni
76.146
-0.167
-0.22%
1 gen 1972 anni
76.709
+0.563
0.74%
1 gen 1973 anni
76.977
+0.268
0.35%
1 gen 1974 anni
76.087
-0.89
-1.16%
1 gen 1975 anni
73.344
-2.743
-3.61%
1 gen 1976 anni
73.845
+0.502
0.68%
1 gen 1977 anni
74.214
+0.369
0.5%
1 gen 1978 anni
73.94
-0.274
-0.37%
1 gen 1979 anni
75.271
+1.331
1.8%
1 gen 1980 anni
74.732
-0.539
-0.72%
1 gen 1981 anni
74.534
-0.198
-0.26%
1 gen 1982 anni
76.29
+1.756
2.36%
1 gen 1983 anni
76.084
-0.206
-0.27%
1 gen 1984 anni
75.906
-0.179
-0.23%
1 gen 1985 anni
76.228
+0.322
0.42%
1 gen 1986 anni
76.636
+0.408
0.54%
1 gen 1987 anni
79.398
+2.761
3.6%
1 gen 1988 anni
79.599
+0.202
0.25%
1 gen 1989 anni
79.8
+0.201
0.25%
1 gen 1990 anni
79.285
-0.515
-0.65%
1 gen 1991 anni
79.047
-0.239
-0.3%
1 gen 1992 anni
78.667
-0.379
-0.48%
1 gen 1993 anni
78.649
-0.018
-0.02%
1 gen 1994 anni
77.654
-0.995
-1.27%
1 gen 1995 anni
77.712
+0.058
0.08%
1 gen 1996 anni
77.839
+0.127
0.16%
1 gen 1997 anni
76.995
-0.844
-1.08%
1 gen 1998 anni
77.179
+0.184
0.24%
1 gen 1999 anni
77.566
+0.387
0.5%
1 gen 2000 anni
79.372
+1.806
2.33%
1 gen 2001 anni
77.724
-1.649
-2.08%
1 gen 2002 anni
77.033
-0.69
-0.89%
1 gen 2003 anni
76.29
-0.743
-0.96%
1 gen 2004 anni
76.039
-0.251
-0.33%
1 gen 2005 anni
75.141
-0.898
-1.18%
1 gen 2006 anni
73.52
-1.62
-2.16%
1 gen 2007 anni
72.564
-0.956
-1.3%
1 gen 2008 anni
72.645
+0.081
0.11%
1 gen 2009 anni
71.948
-0.697
-0.96%
1 gen 2010 anni
71.191
-0.757
-1.05%
1 gen 2011 anni
69.327
-1.864
-2.62%
1 gen 2012 anni
69.558
+0.231
0.33%
1 gen 2013 anni
69.011
-0.547
-0.79%
1 gen 2014 anni
69.038
+0.028
0.04%
1 gen 2015 anni
68.753
-0.286
-0.41%
Classificazione dei paesi secondo i statistiche attuali per anni


Commenti: